Fair Work Act 2009
Annual Wage Review 2009–10
(C2010/1)
|
JUSTICE GIUDICE, PRESIDENT
SENIOR DEPUTY PRESIDENT WATSON
SENIOR DEPUTY PRESIDENT HARRISON
COMMISSIONER RAFFAELLI
MR VINES
PROFESSOR RICHARDSON
MR DWYER
|
MELBOURNE, 3 JUNE 2010
|
ABBREVIATIONS
|
ABI
|
Australian Business Industrial
|
|
ABS
|
Australian Bureau of Statistics
|
|
ACCER
|
Australian Catholic Council for Employment Relations
|
|
ACCI
|
Australian Chamber of Commerce and Industry
|
|
ACOSS
|
Australian Council of Social Service
|
|
ACTU
|
Australian Council of Trade Unions
|
|
AFEI
|
Australian Federation of Employers and Industries
|
|
AFPC
|
Australian Fair Pay Commission
|
|
AFPCS
|
Australian Fair Pay and Conditions Standard
|
|
AHEIA
|
Australian Higher Education Industrial Association
|
|
Ai Group
|
Australian Industry Group
|
|
AIRC
|
Australian Industrial Relations Commission
|
|
ALCI
|
Analytical Living Costs Index
|
|
ANRA
|
Australian National Retailers Association
|
|
APCS
|
Australian Pay and Classification Scale
|
|
APESMA
|
Association of Professional Engineers, Scientists and Managers, Australia
|
|
ARA
|
Australian Retailers Association
|
|
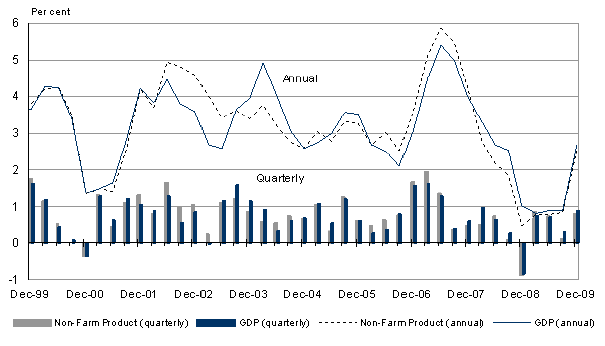
AWE
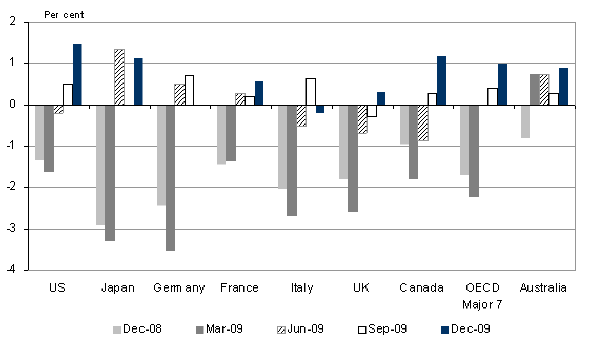
|
average weekly earnings
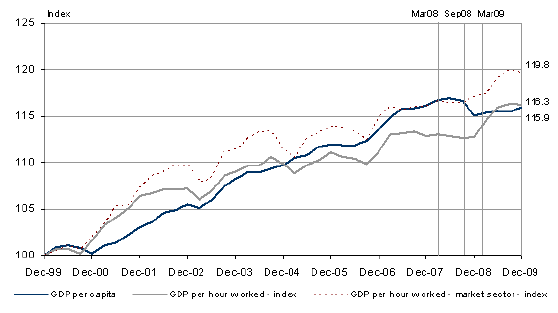
|
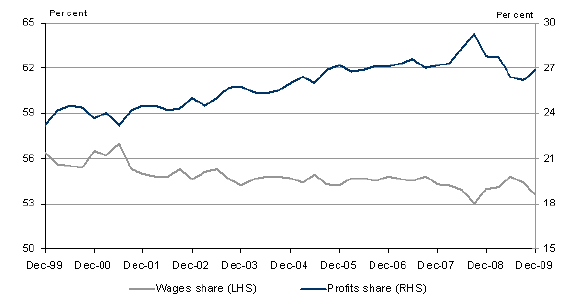
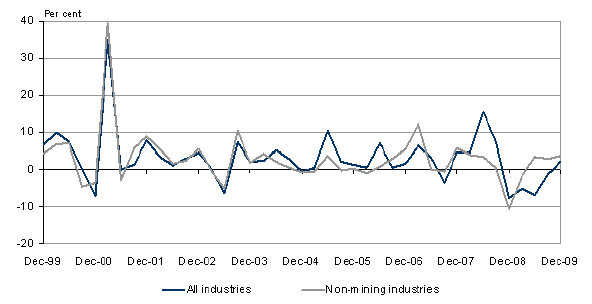
|
AWOTE
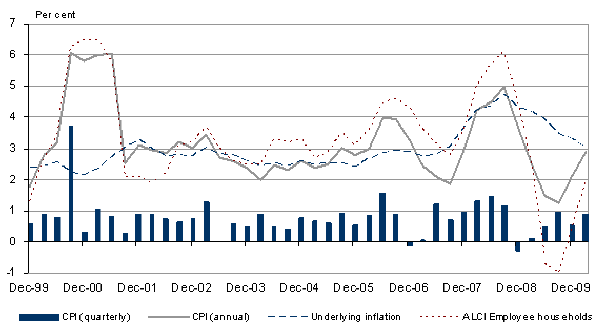
|
average weekly ordinary time earnings
|
|
C1(b)
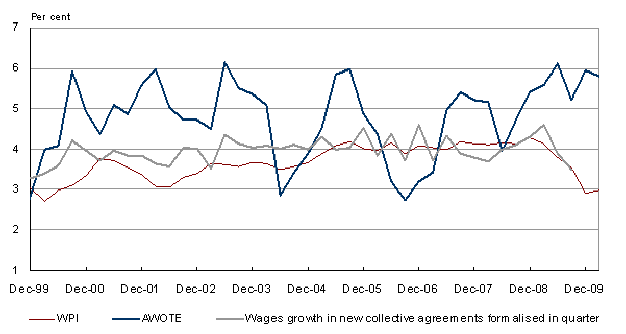
|
Professional Engineer, Professional Scientist Level 4, Metal, Engineering and Associated Industries Award 1998
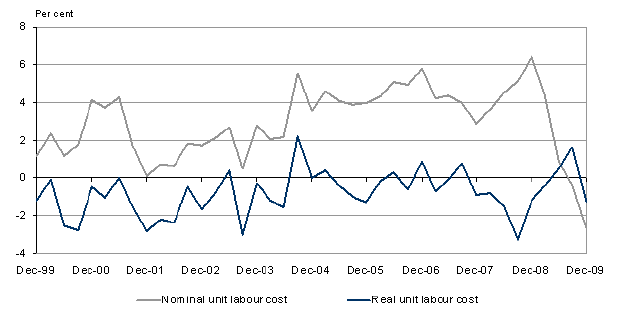
(and from 1 January 2010 the Professional Employees Award 2010)
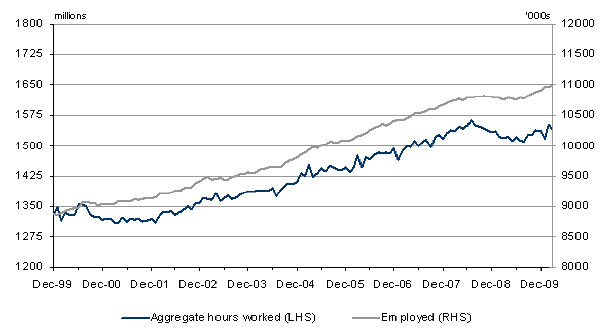
|
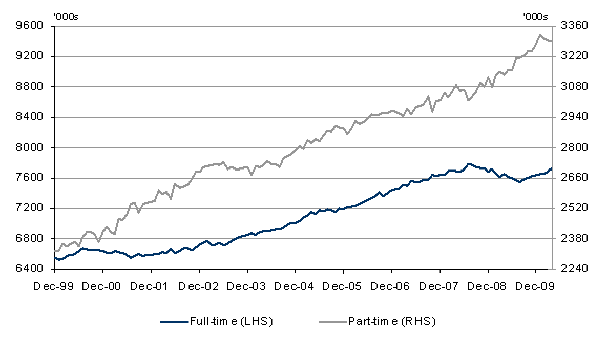
|
C10
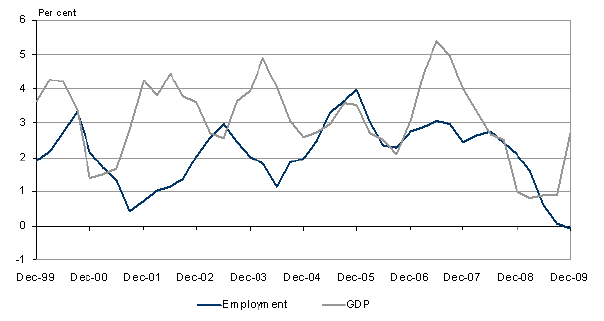
|
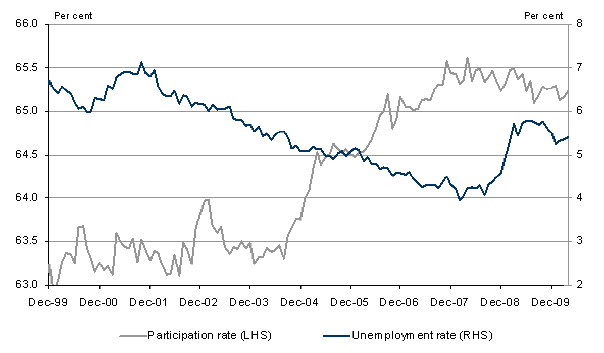
Engineering Tradesperson Level I, Metal, Engineering and Associated Industries Award 1998
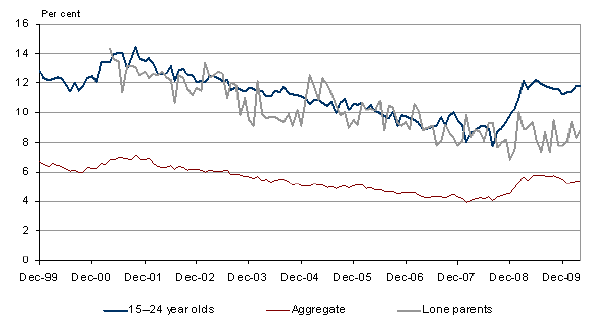
(and from 1 January 2010 the Manufacturing and Associated Industries and Occupations Award 2010)
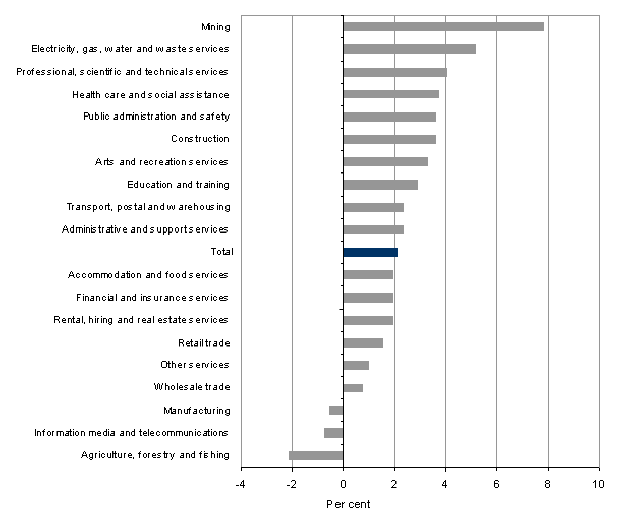
|
|
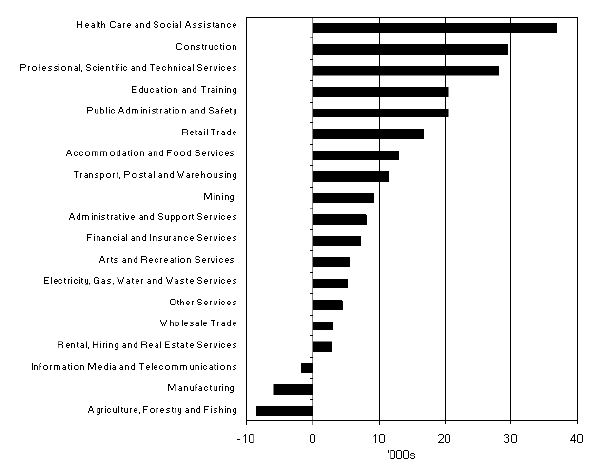
C13
|
Engineering/Production Employee Level II, Metal, Engineering and Associated Industries Award 1998
(and from 1 January 2010 the Manufacturing and Associated Industries and Occupations Award 2010)
|
|
C14
|
Engineering/Production Employee Level 1, Metal, Engineering and Associated Industries Award 1998
(and from 1 January 2010 the Manufacturing and Associated Industries and Occupations Award 2010)
|
|
CCIQ
|
Chamber of Commerce & Industry Queensland
|
|
CCIWA
|
Chamber of Commerce and Industry of Western Australia
|
|
CPI
|
Consumer Price Index
|
|
DEEWR
|
Department of Education, Employment and Workplace Relations
|
|
DSP
|
Disability Support Pension
|
|
EEH
|
Employee Earnings and Hours
|
|
Fair Work Act
|
Fair Work Act 2009
|
|
FMW
|
Federal Minimum Wage
|
|
FMWs
|
Federal Minimum Wage plus special Federal Minimum Wages
|
|
GDP
|
Gross Domestic Product
|
|
GFC
|
global financial crisis
|
|
HIA
|
Housing Industry Association
|
|
HILDA
|
Household, Income and Labour Dynamics in Australia
|
|
HPL
|
Henderson poverty line
|
|
IMF
|
International Monetary Fund
|
|
LITO
|
Low Income Tax Offset
|
|
MBA
|
Master Builders Australia Limited
|
|
MGA
|
Master Grocers Australia
|
|
NAPSA
|
Notional Agreement Preserving State Awards
|
|
NES
|
National Employment Standards
|
|
NFF
|
National Farmers’ Federation
|
|
NMW
|
National Minimum Wage
|
|
NPEC
|
National Pay Equity Coalition
|
|
NRA
|
National Retail Association
|
|
OECD
|
Organisation for Economic Co-operation and Development
|
|
Panel
|
Minimum Wage Panel
|
|
R&CA
|
Restaurant and Catering Australia
|
|
RBA
|
Reserve Bank of Australia
|
|
SACS award
|
Social and Community Services Employees (State) Award
(NSW)
|
|
special NMW
|
special national minimum wage (for employees with disability, junior employees and employees to whom training arrangements apply)
|
|
SWS
|
Supported Wage System
|
|
Transitional Act
|
Fair Work (Transitional Provisions and Consequential Amendments) Act 2009
|
|
VACC
|
Victorian Automobile Chamber of Commerce
|
|
WACOSS
|
Western Australian Council of Social Service Inc
|
|
WEL
|
Women’s Electoral Lobby
|
|
WiSER
|
Women in Social and Economic Research
|
|
WPI
|
Wage Price Index
|
|
WR Act
|
Workplace Relations Act 1996
|
1. Overview
Introduction
[1]
This decision concerns the first Annual Wage Review under the Fair Work Act 2009 (Fair Work Act). A large number of interested organisations and bodies, whom we shall refer to collectively as parties, participated in the review. Many parties lodged written submissions and some also lodged reply and post–Budget submissions in accordance with the published timetable. A number of research projects were undertaken and the resulting reports were made available for use in the review. All of the submissions, the research reports and some additional economic data were published on the Fair Work Australia website (
www.fwa.gov.au
). We also participated in some public consultations in the week of 17 May 2010.
[2]
Before dealing with the issues and the parties’ submissions it is appropriate to give an overview of the relevant statutory provisions.
Relevant provisions of the Fair Work Act
[3]
The Minimum Wage Panel of Fair Work Australia (the Panel) is established under the Fair Work Act. The Panel is required to review modern award minimum wages and to make a national minimum wage order. In addition, the Panel must review minimum wages in various transitional instruments.
[4]
The review of modern award minimum wages and the making of a national minimum wage order are governed primarily by provisions in the Fair Work Act. Because this is the first review under the Fair Work Act there are also relevant provisions in the Fair Work (Transitional Provisions and Consequential Amendments) Act 2009 (Transitional Act). The review of minimum wages in transitional instruments is governed primarily by provisions in the Transitional Act, although in relevant respects the terms of the Fair Work Act are incorporated by reference.
[5]
The Panel is required to conduct an annual wage review in each financial year. Any determination made varying minimum wages in modern awards in the review must come into operation on 1 July in the next financial year, unless there are exceptional circumstances.
1
A national minimum wage order must also come into operation on 1 July in the next financial year, subject to the same qualification.
2
There is also a requirement that where a determination is made varying modern award minimum wages, Fair Work Australia must publish any varied wages in a modern award before 1 July in the next financial year and wages in a modern enterprise award or state reference public sector modern award as soon as practicable.
3
[6]
The Fair Work Act sets out some important process requirements for the review. They include provision of a reasonable opportunity to all persons and bodies to make written submissions, publication of the written submissions and a reasonable opportunity for submissions to be made in reply.
4
In addition any research undertaken or commissioned by the Panel must be published so that submissions can be made addressing issues covered by the research.
5
[7]
The review of modern award minimum wages must be carried out in accordance with the minimum wages objective in s.284 and the modern awards objective in s.134 of the Fair Work Act. We set these provisions out in full later in this chapter. We note, at this stage, that modern award minimum wages include wage rates for junior employees, employees to whom training arrangements apply and employees with disability, casual loadings and piece rates.
6
[8]
In making a national minimum wage order the Panel must be guided by the minimum wages objective in s.284 of the Fair Work Act, and, pursuant to s.294 of the Fair Work Act a national minimum wage order:
“(a) must set the national minimum wage; and
(b) must set special national minimum wages for all award/agreement free employees in the following classes:
(i) junior employees;
(ii) employees to whom training arrangements apply; and
(iii) employees with a disability; and
(c) must set the casual loading for award/agreement free employees.”
Relevant provisions of the Transitional Act
[9]
We deal first with the provisions of the Transitional Act which govern the review of modern award minimum wages and the national minimum wage order. The first annual wage review is to be conducted and completed in the period from 1 January 2010 until 30 June 2010.
7
For the purposes of the first national minimum wage order the existing rates are those set by the Australian Fair Pay Commission (AFPC). Various instruments made by the AFPC are deemed to be transitional instruments made by Fair Work Australia applying to award/agreement free employees.
8
The instruments include a:
● National Minimum Wage (NMW) – set at $14.31 per hour;
● default casual loading of 20 per cent which applies to employees covered by the NMW;
● Special National Minimum Wage 1 – set for employees with disability whose disability does not affect their productivity at the rate of the NMW; and
● Special National Minimum Wage 2 – set for employees with disability whose disability affects their productivity allowing them to apply pro-rata assessments derived from the Supported Wage System (SWS) against the NMW.
[10]
The AFPC did not set a special national minimum wage for junior employees or employees to whom training arrangements apply. The Panel is not required to set special national minimum wages for those employees in the national minimum wage order made in the first annual wage review.
9
[11]
The Transitional Act requires that we review a number of other transitional instruments. Specifically, we must review minimum wages in transitional Australian Pay and Classification Scales (APCSs), Division 2B State awards and State reference transitional awards
10
and may make a determination varying any of those instruments.
11
We deal with these matters in some more detail later in this chapter.
The statutory objectives
[12]
Since this is the first annual wage review under the Fair Work Act it is appropriate to briefly refer to the principles that guided wage reviews recently conducted by the AFPC. In conducting reviews under the Workplace Relations Act 1996
(WR Act) between 2006 and 2009, the AFPC was required to take “wage-setting” parameters into account.
12
The key objective of the AFPC in conducting those reviews was to “promote the economic prosperity of the people of Australia”. For this purpose five criteria were also specified. It is not necessary to repeat them here.
[13]
As noted already, the minimum wages objective in s.284(1) and the modern awards objective in s.134(1) apply to this annual wage review. Section 284(1), which applies to both the review of modern award minimum wages and the review of the national minimum wage order, reads:
“284 The minimum wages objective
What is the minimum wages objective?
(1) FWA must establish and maintain a safety net of fair minimum wages, taking into account:
(a) the performance and competitiveness of the national economy, including productivity, business competitiveness and viability, inflation and employment growth; and
(b) promoting social inclusion through increased workforce participation; and
(c) relative living standards and the needs of the low paid; and
(d) the principle of equal remuneration for work of equal or comparable value; and
(e) providing a comprehensive range of fair minimum wages to junior employees, employees to whom training arrangements apply and employees with a disability.”
[14]
While it is not useful to make a detailed comparison between the minimum wages objective and the parameters which guided the AFPC, there are some important differences which should be noted. In particular s.284(1) contains a requirement that a safety net be established and maintained. Therefore the principal consideration relates to the safety net rather than the “promotion of economic prosperity”. We discuss in some detail later a number of other important considerations which the AFPC was not specifically required to take into account. They include promoting social inclusion through increased workforce participation and relative living standards and the needs of the low paid.
[15]
In reviewing modern award minimum wages we are also required to apply the modern awards objective in s.134(1). Section 134(1) reads:
“134 The modern awards objective
What is the modern awards objective?
(1) FWA must ensure that modern awards, together with the National Employment Standards, provide a fair and relevant minimum safety net of terms and conditions, taking into account:
(a) relative living standards and the needs of the low paid; and
(b) the need to encourage collective bargaining; and
(c) the need to promote social inclusion through increased workforce participation; and
(d) the need to promote flexible modern work practices and the efficient and productive performance of work; and
(e) the principle of equal remuneration for work of equal or comparable value; and
(f) the likely impact of any exercise of modern award powers on business, including on productivity, employment costs and the regulatory burden; and
(g) the need to ensure a simple, easy to understand, stable and sustainable modern award system for Australia that avoids unnecessary overlap of modern awards; and
(h) the likely impact of any exercise of modern award powers on employment growth, inflation and the sustainability, performance and competitiveness of the national economy.”
[16]
It is clear that in carrying out this review we are required to apply an expanded range of considerations. Parties made a variety of submissions about the manner in which we could best carry those criteria into effect. We set these views out later.
Review of transitional instruments
[17]
As noted already, we are required to review transitional APCSs, Division 2B State awards and State reference transitional awards and may vary them. These instruments arise from the application of the relevant provisions of the Transitional Act and the Fair Work (State Referral and Consequential and Other Amendments) Act 2009.
[18]
The Transitional Act provides that relevant provisions of the Fair Work Act apply to the review of transitional instruments.
13
[19]
Subject to some exceptions, Division 2B State awards terminate on 31 December 2010.
14
Fair Work Australia is also presently undertaking a process for the termination of modernisable instruments which include transitional APCSs.
15
[20]
It is important to note that if the rates in a Division 2B State award fall below the national minimum wage the national minimum wage applies instead.
16
Publication of instruments
[21]
We have already noted that there are provisions in the Fair Work Act setting out various publication requirements including the requirement that any determination varying modern award minimum wages should operate from 1 July in the next financial year unless there are exceptional circumstances.
17
The requirement to publish varied modern award minimum wages is set out in s.292. It reads:
“292 Varied wage rates must be published
(1) If FWA makes one or more determinations varying modern award minimum wages in an annual wage review, FWA must publish the rates of those wages as so varied:
(a) for wages in a modern award (other than a modern enterprise award or a State reference public sector modern award) — before 1 July in the next financial year; and
(b) for wages in a modern enterprise award or a State reference public sector modern award — as soon as practicable.
Note: FWA must also publish the modern award as varied (see section 168).
(2) The publication may be on FWA’s website or by any other means that FWA considers appropriate.”
[22]
While there is a requirement under the Fair Work Act to publish varied minimum wages in modern awards, modern enterprise awards and State reference public sector modern awards, there is no requirement under the Transitional Act to publish varied wage rates in transitional APCSs, Division 2B State awards or State reference transitional awards.
[23]
Some different considerations apply in relation to the publication of the national minimum wage order. Like a determination varying modern award minimum wages, a national minimum wage order must take effect from 1 July in the next financial year unless there are exceptional circumstances.
18
In addition, the legislation specifies the form in which the order must be expressed. Section 295 provides:
“295 Content of national minimum wage order — other matters
Expressing minimum wages and the casual loading
(1) In a national minimum wage order:
(a) the national minimum wage, and the special national minimum wages, set by the order must be expressed in a way that produces a monetary amount per hour; and
(b) the casual loading for award/agreement free employees must be expressed as a percentage.
Note: The means by which the national minimum wage or a special national minimum wage may be expressed include:
(a) a monetary amount per hour; or
(b) a monetary amount for a specified number of hours; or
(c) a method for calculating a monetary amount per hour.
Terms about how the order applies
(2) The order may also include terms about how the order, or any of the requirements in it, applies.”
[24]
Against the background of the content and requirements for the review we now turn to deal with the proposals advanced by the parties.
2. Proposals of the Parties
[25]
The transitional NMW, derived from the transitional standard federal minimum wage, is $14.31 per hour. This would be equivalent to $543.78 for a 38 hour week.
[26]
This chapter discusses proposals, put forward by the parties, in respect of both the quantum of any increases to modern award minimum wages and the NMW. Some parties also submitted approaches to be taken by the Panel in arriving at its decision rather than a quantum. Submissions were received from a wide range of parties – from Federal and State Governments, collective bodies representing employees, employers and other specific groups to private individuals. The following proposals were among those submitted by the parties.
Proposals for a specific dollar quantum of increase
[27]
The Women’s Electoral Lobby (WEL) and National Pay Equity Coalition (NPEC) jointly recommended that the NMW be increased by $49.00 or 9 per cent. This would set the weekly rate at $592, a figure relative to average weekly earnings of 48.5 per cent – just short of the pre-AFPC era.
[28]
The Australian Council of Trade Unions (ACTU) submitted that the Panel should increase minimum wages, in both modern awards and minimum wage orders, by $27.00 a week, with effect from 1 July 2010.
[29]
The Australian Chamber of Commerce and Industry (ACCI), supported by Master Builders Australia Limited (MBA), Victorian Automobile Chamber of Commerce (VACC), Australian Federation of Employers and Industries (AFEI), Chamber of Commerce and Industry of Western Australia (CCIWA) and Chamber of Commerce & Industry Queensland (CCIQ), and the National Retail Association (NRA), submitted that the NMW should be increased to $556.40, an increase of $12.62. In relation to modern award rates of pay, ACCI submitted that the Panel should grant an increase of not more than $12.50 per week for employees earning up to the C10 tradesperson classification rate of $637.60 per week. For employees earning in excess of the C10 trade rate, ACCI submitted that there should be an increase granted of $10.50 per week.
[30]
Business SA and the Motor Trades Association of Australia Industrial Council advocated a tiered wage increase identical to that contained in the ACCI submission.
[31]
The Western Australian Government submitted that the Panel should make a determination that maintains the real value of the NMW and modern award minimum wage rates, which would be best achieved by reference to the 2009–10 estimated year average Consumer Price Index (CPI), as published in the 2009–10 Australian Government Budget. Based on their forecast for the national CPI in 2009–10 (2.25 per cent), this would result in a flat dollar increase of $12.20 per week to the NMW and modern award wage rates, and a new NMW of $555.98 per week.
[32]
The Australian Industry Group (Ai Group) submitted that the NMW be increased by $0.32 per hour ($12.00 per week) to $14.63 per hour ($555.94 per week), and that award minimum wages for adults be increased by $12.00 per week.
[33]
The Australian Retailers Association (ARA) recommended that Fair Work Australia hand down a “realistic and manageable” minimum wage increase of no more than $10.50 per week.
[34]
The National Farmers’ Federation (NFF) submitted that, in consideration of the economic circumstances of the agriculture industry and the role of the setting of minimum wages, an increase of no more than $10.00 per week to all minimum wages is justified.
[35]
The Australian National Retailers Association (ANRA) also recommended that Fair Work Australia grant a $10 per week increase in the NMW, recognising that the retail sector faces a number of challenges in 2010.
[36]
The Housing Industry Association (HIA) argued that wage increases approaching and upwards of $30 per week are unreasonable, unrealistic and unsustainable for employers in the residential construction industry.
Proposals for a percentage change increase, including CPI-based adjustments
[37]
The
Australian Catholic Council for Employment Relations (ACCER)
submitted that Fair Work Australia should adopt the cleaner’s base rate of $582.80 per week as the NMW. If that is rejected, ACCER submitted that a “truly national” NMW should be not less than the highest participating state rate after the state rates are adjusted. ACCER also submitted that modern award wages should be varied for a CPI adjustment to cover price rises since the last decision was made in July 2008. The CPI figure over the year to the March quarter 2010 was 5.4 per cent.
[38]
Master Grocers Australia (MGA) and Australian Business Industrial (ABI) submitted that a moderate increase to the minimum wage should be implemented by the Panel and suggested an increase of no more than 2.5 per cent for the NMW and modern award wages.
[39]
The New South Wales and Queensland Governments supported a percentage increase that maintains the real value of wages in line with the CPI.
[40]
Restaurant and Catering Australia (R&CA) submitted that a CPI-based increase be applied on the basis of take-home pay, and that this would require some compensation for tax cuts granted throughout the year. R&CA submitted that an increase of $13.05 or 2.4 per cent should be granted.
[41]
The Australian Higher Education Industrial Association (AHEIA) supported the concept of a “fair and reasonable wage in the Australian tradition” and proposed that rates should be adjusted, in order to maintain their safety net standard, by an appropriate percentage increase.
[42]
The South Australian Wine Industry Association Incorporated strongly opposed any increase to wage rates in excess of CPI. Growcom supported a modest increase to the minimum wage, in line with CPI increases since the last AFPC increase to the minimum wage.
Proposed approaches for varying minimum wages
[43]
A
number
of submissions emphasised approaches to adjusting minimum wages that would maintain their real value since the last minimum wage adjustment. The Australian Government urged the Panel
to grant a considered real increase in minimum wages that, at a minimum, reflects the cost of living increases since the last minimum wage rise.
19
The South Australian Government expressed the position that consideration should be given primarily to maintaining the real value of minimum wages over time.
[44]
Australian Council of Social Service (ACOSS) submitted that, in its decision this year, Fair Work Australia should substantially increase real minimum wages in order to quickly restore the decline in their real value due to last year’s “freeze” and to prevent minimum wages from permanently falling further behind median pay levels. They also argued that minimum wage rates for young people, apprentices and trainees, and people with disabilities under the SWS, should continue to be increased in line with the rise in the NMW.
[45]
Western Australian Council of Social Service Inc (WACOSS) submitted that the Panel should have regard to the true cost of living for low-income employees when determining the appropriate increase in minimum wages. Further, it was suggested that an approach examining only the “headline” CPI figure is inadequate, as this would represent a reduction in the minimum wage’s real value.
[46]
R&CA submitted that a “catch up” for last year, as argued by the union movement, is unwarranted as the 2009 decision reflected Australia’s economic circumstances at that time – as evidenced by the Australian Government’s significant policy response to the global financial crisis (GFC).
[47]
A number of parties argued for a percentage increase in order to maintain relativities, to prevent further erosion of relativities or for some other reason. These included the New South Wales and Queensland Governments, ACCER, AHEIA and the Association of Professional Engineers, Scientists and Managers, Australia (APESMA). APESMA drew the Panel’s attention to its submission to the 2006 Wage-Setting Review, providing information that showed the “serious erosion” of relativities that had taken place due to ongoing decisions that awarded flat money increases. APESMA submitted that this had seriously weakened the safety net for professional employees.
[48]
Other submissions advocated maintaining relativities with other sectors of the community. WEL and NPEC jointly submitted that the 2009–10 decision ought to grant an increase that alleviates the burden unfairly placed upon the most vulnerable sector of the workforce and that the increase should, at the very least, return the minimum wage-average weekly earning relativity that existed prior to the regime established under the AFPC. Women in Social and Economic Research (WiSER) submitted that the minimum wage should be increased to maintain not only its real value but also relativity with earnings of others in the community. It submitted that average weekly ordinary time earnings (AWOTE) for Australia rose by 5.9 per cent (seasonally adjusted) between November 2008 and November 2009 and, without a comparable increase in wages for minimum wage earners, fairness and equity in Australian labour markets are likely to decline further. ACCER proposed that relativities within awards and between safety net rates and community wage levels are important matters in the development of the new wage-setting system. They proposed that this should be addressed at a hearing early in the new financial year.
3. The Economy
3.1 Views of the Parties on the Economy
[49]
The submissions tendered by the parties drew on established data sources to support their views of developments in the Australian economy and the outlook for growth. The submissions of the parties varied in the importance they assigned to elements of the data and, accordingly, advanced a range of conclusions about the economy for the Panel to consider.
Economic growth
[50]
The Australian Government submission stated that “[t]he Australian economy has demonstrated resilience against a background of still challenging global conditions.”
20
In year-average terms, Australia’s economy grew more strongly than the other advanced economies in 2009. This view of recent economic conditions was reflected in a number of submissions including those of the Victorian Government and the ACTU.
[51]
Some submissions recognised that Australia’s economy has performed better than had been forecast.
The Victorian Government submitted that recent improvement in economic conditions and upgraded growth forecasts are well above the 2009 forecasts.
The ACTU asserted that the “Australian economy performed strongly throughout 2009” and relied on the following passage from the Reserve Bank of Australia’s (RBA’s) February 2010 Statement on Monetary Policy:
“The Australian economy has continued to perform better than had been expected, supported by stimulatory settings of monetary and fiscal policy, high population growth, strong trade links with Asia, and a sound financial system. Compared with the experience elsewhere around the world, the downturn in the Australian economy was relatively mild, with Australia one of only a few economies that did not record negative year-ended growth.”
21
[52]
However, ACCI submitted in reply that growth of 2.7 per cent is modest by historical standards and weaker than it appears when regard is had to strong population growth.
[53]
Some submissions noted the impact and importance of the fiscal stimulus in reducing the extent of the downturn. Ai Group submitted that “[t]he partial recovery of growth over the past year has been largely driven by strong fiscal stimulus which boosted public sector consumption and investment.”
22
ACCI submitted that the timely response of fiscal and monetary policy stimulus supported domestic activity.
[54]
The Australian Government submitted that the “stimulus measures were specifically designed to have their greatest impact in the first half of 2009, when the economy was expected to be at its weakest. As economic conditions improved, the impact of the stimulus has been gradually winding down, starting from the second half of 2009.”
23
The Australian Government’s submission estimated that the winding down of fiscal stimulus will subtract one percentage point from economic growth in 2010. The withdrawal of the stimulus was designed so that the economy would have a smooth transition from being driven by public demand to being driven by private demand.
[55]
ACCI argued that it is not clear that the necessary recovery in private sector activity is taking place or will be sufficient to return growth to trend in 2010. ACCI expressed concern that growth is focussed on the mining industry, submitting that the award-reliant sectors of the economy will not benefit directly from such growth.
Productivity
[56]
Some submissions recommended caution in interpreting productivity data. Specifically, ACCI argued that recent improvements in productivity are “more a function of the unwinding of the impact of ‘labour hoarding’ rather than a sustainable improvement in operating performance.”
24
Similarly, the Queensland Government warned that the productivity outcome “should be interpreted with caution given the reduction in aggregate hours worked and the current phase of the business cycle.”
25
[57]
With respect to productivity however, the ACTU commented that moderate and predictable minimum wage increases would have a positive effect on productivity growth as “effective and enforced minimum wages ensure that the least productive/competitive firms do not depend for their survival on strategies predicated on undercutting their competitors’ unit labour costs.”
26
[58]
The Victorian and New South Wales Governments submitted that there was no evidence to suggest that an increase in minimum wages would have a negative effect on productivity.
Business competitiveness and viability
[59]
ACCI submitted that the economic downturn has had an adverse effect on business profits, stating that “the burden of the economic downturn has been borne disproportionately by business via sharply reduced profitability, as is typically the case during a period of recession.”
27
ACCI also noted that the rise in the profit share of total factor income over time has not led to a decline in the wages share, arguing that “for the most part [the increase in the profit share] merely reflects a change in the legal form under which businesses are operated.”
28
[60]
The Victorian Government submitted that, based on the analysis of the Victorian Workplace and Industrial Relations Survey, an increase in the minimum wage will “not have a detrimental effect on business performance and profitability.”
29
[61]
The ACTU submitted that “regular, moderate and predictable minimum wage increases” are benign for inflation, employment, and international business competitiveness and positive for productivity growth. They contended that minimum wage earners are “overwhelmingly in the ‘non-traded’ domestic sector in small firms.”
30
[62]
Drawing upon international evidence, the ACTU submitted that “typical minimum wage” increases would have a benign impact on employment because “elasticities hover around zero” and commented that “in any event any employment impact of changes to minimum wages is swamped by other factors in a dynamic growing economy with continuing structural change.”
31
[63]
The Australian and Victorian Governments supported the view that “regular, moderate and predictable minimum wage increases” would have no adverse effect on, specifically, employment.
32
ACCI, however, submitted that such increases are not always preferable and commented that “there may be instances where an increase can be sustained in one annual wage review, whilst the same increase may not be sustainable in another review.”
33
[64]
ACCI also noted in its submission in reply that research on the effects of wage adjustments on small businesses is limited and as a result, “insufficient examination has been undertaken of the capacity of small businesses to bear the cost imposed on them by mandated increases in award rates of pay.”
34
ACCI urged Fair Work Australia to conduct further research in this area.
[65]
The New South Wales Government submitted that, over the timeframe in which the AFPC set minimum wages, profits increased steadily in sectors that are relatively more award-reliant, such as retail trade and accommodation and food services.
Inflation and wages
[66]
Many submissions commented that the slowdown in the economy has led to a moderation in the rate of inflation. However, the Victorian Government cautioned that “upside risks” remain, particularly “in the form of persistent inflation in the housing rental market and an expected increase in the cost of utilities, as well as potential inflationary impacts from highly stimulatory policy settings.”
35
[67]
In response to the increase in the CPI over the year to the March quarter 2010, ACCI submitted that it was at the higher end of the RBA’s medium-term target band of 2–3 per cent and that “wage-price inflation could be a risk as the economy further recovers thereby leading to higher interest rates.”
36
[68]
The ACTU submitted that its claim for a $27.00 per week increase to the minimum wage would not add to inflationary pressures. The submission stated that “the cost of its claim adds a negligible 0.30 per cent to ordinary time earnings and a barely measurable CPI impact of 0.16 per cent.”
37
[69]
ACCI submitted that the methodology adopted by the ACTU contained a “number of flaws” and that important caveats need to be attached to the analysis. ACCI argued that increases in minimum wages would not only affect award-reliant workers but would indirectly flow on to a significant proportion of the workforce that is award dependent.
ACCI also submitted that the relationship between minimum wage increases and the inflation rate is not static, claiming that:
“An increase in minimum wages without any corresponding rise in labour productivity will generate a wage-inflation spiral that will result in the inflation impact being greater than the 0.16 per cent increase estimated by the ACTU.”
38
[70]
In relation to wages growth, the Australian Government’s submission noted that “[t]he continued moderation has been driven by slower growth in private sector wages.”
39
The Victorian Government submitted that private sector wage growth will moderate from “the consistently above average quarterly growth rates seen throughout 2008.”
40
[71]
ACCI asserted that private sector wages provide a better measure of the labour market and the capacity of businesses to afford increases in minimum rates of pay. ACCI noted the slow pace of private sector wage growth, the increase in unemployment and the decline in hours worked as evidence of the impaired ability of businesses to sustain any increase in minimum rates of pay. ACCI argued that:
“Rather than signalling any need to increase minimum rates of pay, the slowing rate of real wages growth should rather be viewed as a signal of the economy’s diminished capacity to sustain artificially higher wages.”
41
[72]
The Australian Government noted that wage outcomes in collective agreements have been modest. It commented on recent data and highlighted that the 3.5 per cent per annum pay increase for the September quarter 2009 was the lowest average pay increase recorded in more than five years, and that “in general terms, employers, employees and unions are exercising restraint when negotiating wages in collective agreements.”
42
Labour market
[73]
The Australian Government submitted that employment growth is the most important consideration in assessing the performance and competitiveness of the national economy. It also argued, in terms supported by the ACTU, that:
“… it would be inconsistent with the objectives of the new system if minimum wage increases were rejected, both during periods of economic weakness (due to potential impact on employment growth) and during periods of economic strength (due to potential impact on inflation).”
43
[74]
Many parties noted that the labour market demonstrated resilience and surpassed expectations. The Australian Government submitted that the unemployment rate has decreased despite strong labour force growth, with the creation of new jobs exceeding new entrants to the labour force. It noted that the February unemployment rate was one of the lowest unemployment rates of all the major advanced economies.
The ACTU, Ai Group and the Victorian Government noted that the unemployment rate peaked at lower than forecast and has since been steadily declining.
Ai Group argued that the resilience in employment reflected stimulus policy, lower real unit labour costs and firms reducing hours worked rather than cutting jobs.
[75]
The Australian Government noted that the decline in unemployment was driven by strong growth in both full-time and part-time employment. In particular, it argued that growth in part-time employment, in part, reflected employers reducing hours during the global economic downturn to avoid redundancies and retain staff. ACCI argued that there is increased flexibility in the industrial relations system which has led to temporary reductions in hours worked as opposed to job losses. Ai Group cautioned that employers will need to see a sustained lift in economic growth before switching to full-time employment. However, the ACTU replied that since August 2009, “more full time jobs have been created than part-time jobs.”
44
[76]
ACCI submitted that the reduction in hours worked across the economy during the downturn has been “severe”. ACCI noted that, after peaking in July 2008, the total number of hours worked in the economy declined by 3.4 per cent over the 13 months to August 2009, amounting to the loss of the equivalent of more than 300 000 full-time positions. In contrast, the ACTU noted that aggregate hours are now “at their highest level since the previous peak of July 2008”.
45
However, the Australian and New South Wales Governments submitted that average hours have fallen. In particular, the Australian Government argued that “average
hours worked remain well below their trend peak.”
46
[77]
The Australian Government noted that the participation rate did not experience a decline normally associated with the discouraged-worker effect, unlike in previous downturns.
47
Labour market by industry/occupation
[78]
The ACTU submitted that employment increased in the February quarter 2010 for industries with more than 10 per cent award reliance (accommodation and food services, administrative and support services and health care and social assistance), except for retail trade. The Australian Government noted that while fiscal stimulus measures had provided considerable support to the retail sector, the downturn in consumer spending had weakened employment growth.
[79]
In contrast, ACCI submitted that “the increase in labour demand has been largely concentrated in high-skilled and professional sectors rather than those industries which tend to employ the low-paid”.
48
[80]
The ACTU submitted that total employment increased over the year to the February quarter 2010 in three of the five occupations with more than 10 per cent of award-reliant employees (sales workers, community and personal service workers and labourers).
49
Outlook
[81]
The submissions received by the Panel generally pointed to the improvement in the global economy. Many cited the International Monetary Fund (IMF) April 2010 World Economic Outlook
forecasting global GDP growth of 3.9 per cent in 2010 after a contraction of 0.8 per cent in 2009. ACCI submitted that the IMF April 2010 World Economic Outlook
“flagged rising sovereign debt levels as a potential risk to the global economic recovery”.
50
[82]
In its initial submissions, the Australian Government submitted that growth forecasts for the Australian economy have been significantly upgraded between the 2009–10 Budget forecasts and the November Mid-Year Economic and Fiscal Outlook.
51
However, it believes that challenges and some level of volatility will remain in the short-term, with the economy expected to be operating below capacity for some time. It noted that the withdrawal of the fiscal stimulus was designed to shift the economy from being driven by public demand to being driven by private demand as smoothly as possible. The impact of the fiscal stimulus peaked in June and is expected to subtract one percentage point from economic growth in 2010 as private sector activity is anticipated to expand. The Australian Government submitted that:
“Although global financial conditions have stabilised and the world economy is growing again, the global recovery remains fragile and a sustained recovery in the major advanced economies is not yet assured.”
52
[83]
In its post-Budget submission, the Australian Government noted the improved outlook for the Australian economy in the Budget, with stronger growth and a continuing fall in unemployment expected in the context of moderation in inflation. It submitted that:
“Australia’s strong performance through the recent global economic downturn and the Budget’s improved economic forecasts support the Government’s position that there should be a considered real increase in minimum wages that, at a minimum, reflects the cost of living increases since the last minimum wage rise.”
53
[84]
The Australian Government submitted that the better than expected economic performance and outlook outlined in the Budget provides increased capacity for the Panel to grant a considered real increase to minimum wages so that the low paid can fairly share in Australia’s economic prosperity.
[85]
In its post-Budget submission, the ACTU submitted that the Budget documentation reinforces its previous submission that the Australian economy is recovering steadily from the mild downturn and the prospects for the Australian economy are good. The ACTU also submitted that the Budget “makes no significant changes to transfer and taxation arrangements for award workers that alter the fundamental thrust”
54
of the ACTU’s previous submissions and observed that while Treasury notes that the global economy presents risks to the domestic outlook, it also notes potential for the global economy to recover more strongly, with flow-on effects to the Australian economy. It submitted that “[t]he economic outlook supports the granting in full of the ACTU claim of $27.00 per week.”
55
[86]
A number of other submissions noted downside risks and uncertainty for the future of the Australian economy. The cautionary outlook generally revolved around the issues of a declining fiscal stimulus, the potential for a two-speed economy and the economic conditions of our trading partners.
[87]
Ai Group submitted that the increase in global activity reflects temporary factors such as fiscal and monetary policy settings and an increase in private sector demand is also critical. Ai Group submitted that many of their indicators for key sectors suggested that growth in 2010 would be moderate rather than strong. They expected an improvement in activity across the manufacturing, construction and services sectors with activity likely to be strong in the services and manufacturing sectors. Ai Group also cautioned that while Australian economic growth is likely to improve in 2010, it is unclear whether private sector consumption and investment will sufficiently replace the public sector as the fiscal stimulus fades and interest rates rise.
[88]
In its post-Budget submission, Ai Group submitted that more recent domestic economic data suggest ongoing improvement in the overall economy, though soft spots remain reflecting the impacts of tighter monetary policy and the fading of earlier policy stimulus. It noted negative retail sales growth in the first few months of 2010, as higher interest rates and still high levels of household indebtedness constrain consumer demand. Ai Group urged caution about the strength of retail sales over coming months, in light of RBA increases in the official interest rate since October 2009 and the potential for further increases.
[89]
The Victorian Government also submitted that the economic outlook remains uncertain, and “… key downside risks include inflationary pressures from stimulatory policy settings and negative trade impacts from a strong Australian dollar.”
56
It expressed concern about the response of private sector demand to the withdrawal of fiscal stimulus. The Victorian Government submitted that there are also upside risks from rebounding commodity and asset prices, as well as the global recovery gaining traction as confidence is rebuilt in the North Atlantic economies more quickly.
[90]
The New South Wales Government noted that the RBA and private sector have also revised upward their forecasts for Australian and global growth, but noted downside risks remain as private sector demand is yet to show a sustained recovery.
[91]
Based on an assessment of the 2009–10 Mid-Year Economic and Fiscal Outlook and the RBA’s February Statement on Monetary Policy, ACCI submitted that the economy had experienced the worst of the downturn and a “self-sustaining” recovery would unfold as 2010 progressed. However ACCI cautioned that any “self-sustaining” recovery would need to be led by the private sector, which despite the strong outlook for the mining sector remained uncertain.
[92]
ACCI was concerned with the creation of a two-speed economy and urged the Panel to take into account the risks that remain in the Australian economy:
“The potentially very uneven recovery in economic growth needs to be taken into consideration when determining the appropriate uprating of minimum wages. The mining investment boom promises to lead to strong growth in that sector and associated construction activities but if Fair Work Australia were to find that minimum wage reliant industries were nevertheless likely to struggle in the year ahead the increase in the minimum wage that could reasonably be entertained as appropriate would be limited accordingly. Not only does the strength of the economic recovery need to be taken into consideration but also its composition.”
57
[93]
In its post-Budget submission, ACCI noted a positive overall outlook for private investment, but noted that the improved investment outlook was driven by the mining sector, with a weaker outlook for the engineering construction and non-residential building sectors, reflecting the emergence of the “two-speed economy”.
58
[94]
NFF submitted that the future of Australian agriculture is dependent on the economic conditions of Australia’s trading partners and the pace of recovery across individual countries remains uneven.
[95]
ACCI submitted that businesses were expecting prices to increase over 2010 as the economy recovers.
59
However, ACCI acknowledged the official forecasts that inflation is expected to be low, stable and consistent within the RBA’s 2–3 per cent target over the medium-term.
60
The outlook for inflation submitted by the Australian Government was for moderate growth “reflecting the easing in capacity pressures over the past year and moderating labour costs.”
61
However, the Victorian Government submitted that due to underlying inflation not falling as low as expected, signs of growing price pressures may lead to faster increases in interest rates.
62
[96]
In its post-Budget submission, ABI highlighted the downside risks identified in the Budget outlook. Whilst it noted the further improved outlook in the revised forecasts, it noted the view expressed that “[t]he global economy nevertheless presents risks to the domestic outlook”,
63
referring to the potential spread of the sovereign debt crisis in Greece and potential economic weakness in China.
[97]
The NFF submitted that significant rainfall in recent months has eased the pressure across many drought affected areas but also noted research that suggests it takes two to three years to fully recover from a drought. It submitted that the decrease over the coming 12 months of the number of drought declared areas that are eligible for Exceptional Circumstances government assistance as a consequence of rain would “change the parameters upon which farmers operate their business”,
64
particularly with respect to a greater reliance on finance which they argued is becoming more difficult to access.
[98]
The Australian Government submitted that private sector business surveys indicated an increase in the growth rate of labour costs, albeit from low levels, and that the upside risk to wages growth would come from better than expected growth in employment. It submitted that employment is expected to continue expanding in the short-term, but at a “somewhat less robust pace than the remarkable rate recorded in late 2009”.
65
However, beyond the near-term, it expected that:
“… a likely strong pick-up in business investment in the resources sector, in particular, may result in some acceleration in labour market activity during the second half of 2010, although this will be contingent upon the RBA’s interest rate stance over the course of the year.”
66
[99]
Ai Group was concerned that uncertainty around the economic outlook would discourage employers from hiring full-time workers. They referred to the Department of Education, Employment and Workplace Relations’ (DEEWR) Skilled Vacancy Index which showed an increase in line with employment growth since early 2009, however, it was yet to reach the levels of the decade prior to 2008. ACCI noted that its Survey of Investor Confidence
“showed that the index of Expected Number of Full-time Employees
rose above the 50 mark for the first time since July 2008, suggesting that hours worked and business hiring intentions are expected to improve over the first half of 2010.”
67
[100]
The ACTU argued that the outlook for the labour market appears positive, supported by the increase in total job advertisements in the ANZ Job Advertisement Series, and supports the granting of the ACTU’s claim. The ACTU submitted that “[t]he labour market is forecast to tighten, with average hours worked rising and employment continuing to grow.”
68
3.2 The Economy—Data
Economic growth
[101]
Economic growth, as measured by growth in real GDP, peaked at over 5 per cent over the year to the June quarter 2007 before slowing to around 1 per cent by late 2008. The decrease in activity in the December quarter 2008 was the first quarterly contraction in eight years. GDP growth began to pick up again in 2009, and had moved closer towards its trend annual growth rate of around 3 per cent later that year. Annual growth in non-farm product peaked slightly higher in mid 2007 and reached a lower minimum in December 2008 relative to GDP.
Chart 3.1: Economic growth, annual and quarterly growth rates
Note: All data are in seasonally adjusted terms.
[Source: Australian Bureau of Statistics (ABS), Australian National Accounts: National Income, Expenditure and Product, Dec 2009, Catalogue No. 5206.0.]
[102]
Growth in GDP for the December quarter 2009 was positive across the Organisation for Economic Co-operation and Development (OECD) major seven countries except for Italy. However, over the year to the December quarter 2009 growth in most of these countries was negative, ranging from –3.3 per cent in the United Kingdom to –0.3 per cent in France. The United States’ GDP grew by 0.1 per cent over the year to the December quarter 2009.
Chart 3.2: International comparisons of quarterly GDP growth
Note: All data are in seasonally adjusted terms.
[Source: ABS, Australian Economic Indicators, Apr 2010, Catalogue No. 1350.0.]
[103]
The Australian economy performed better than other developed countries during the global economic crisis. Although GDP fell in the December quarter 2008, the fall was relatively mild compared with that of other countries, while the increases over the two successive quarters were relatively strong.
Productivity
[104]
Labour productivity, as measured by GDP per hour worked for all sectors and for the market sector,
69
has been volatile over the past 10 years after being relatively high during the late 1990s. While there was a fall in the September quarter 2008 labour productivity has increased in every quarter since. GDP per capita has also grown over the same period, but remains below its mid 2008 peak.
Chart 3.3: Measures of productivity, index
[Source: ABS, Australian National Accounts: National Income, Expenditure and Product, Dec 2009, Catalogue No. 5206.0.]
Business competitiveness and viability
[105]
The profit and wages shares of national income represent the returns to capital and labour, respectively, in the process of production. Over the past decade, the profits share of national income rose while the wages share declined. This trend was interrupted during the downturn.
Chart 3.4: Profits and wages shares of national income
Note: All data are in seasonally adjusted terms.
[Source: ABS, Australian National Accounts: National Income, Expenditure and Product, Australia, Dec
2009, Catalogue No. 5206.0.]
[106]
Growth in company gross operating profits fluctuated over the decade but mostly remained positive. After a peak in the June quarter 2008, profits fell for each of the four quarters to the December quarter 2009 when growth resumed. Profits in the non-mining industries were less volatile.
Chart 3.5: Company gross operating profits, quarterly growth rates
Note: A break in the series occurs at the March quarter 2001 due to changes in the survey design.
[Source: ABS, Business Indicators, Australia, Dec 2009, Catalogue No. 5676.0.]
Inflation
[107]
The CPI measures changes in the prices of a “basket” of goods and services weighted to the expenditure patterns of the average household. The CPI is affected by large temporary movements in the price of its components, while measures of underlying inflation, generally exclude product categories with greater price volatility.
70
[108]
In addition to the CPI, the Australian Bureau of Statistics (ABS) compiles Analytical Living Cost Indexes (ALCI) specifically designed to measure changes in living costs of different groups in the community. Such indexes are conceptually different from the CPI. ALCIs reflect changes over time in the purchasing power of the after-tax incomes of households and measure changes in the prices of goods or services for which payments were made to gain access to those goods and services. The CPI is designed to provide a general measure of price inflation of goods and services faced by households by measuring changes in the prices of goods and services acquired.
[109]
There are three areas of expenditure in which these conceptual approaches provide significantly different results:
● purchase of dwellings;
● purchase of durable items; and
● financial services and the use of credit.
[110]
Annual growth in both the CPI and the ALCI for employee households was relatively stable in the first half of the decade, with the CPI remaining mostly within the RBA’s medium-term target band of 2–3 per cent. In the last two years there has been a substantial divergence between the CPI and the employee ALCI. A major cause of the divergence has been the fact that the CPI does not take into account mortgage interest or consumer credit charges, while the employee ALCI does.
[111]
All three measures of inflation have fallen from their recent peaks in the September quarter 2008. Some of the main components that have contributed to the decrease in the CPI are automotive fuel, motor vehicles, deposit and loan facilities and pharmaceuticals. The decrease in the CPI has been greater than that for underlying inflation, as a result of the price volatility across these products. In the March quarter 2010 the CPI increased by 0.9 per cent, giving an annual rate of 2.9 per cent, and the employee household ALCI increased by 1.3 per cent giving an annual rate of 1.9 per cent. The RBA’s measure of underlying inflation increased by 0.8 per cent in the same quarter, yielding an annual rate of 3 per cent.
Chart 3.6: Measures of inflation
[Source: ABS, Consumer Price Index, Australia, Mar 2010, Catalogue No. 6401.0; ABS, Analytical Living Cost Indexes for Selected Australian Household Types, Mar 2009, Catalogue No. 6463.0.]
Wages
[112]
The Wage Price Index (WPI) grew at an annual rate of 3 to 4 per cent over the past decade. Over the year to the March quarter 2010 the WPI grew by 3 per cent.
[113]
The AWOTE measure was volatile over the past decade, with the series generally trending upwards since 2006 to an annual growth of 5 to 6 per cent. Average annualised wage increases for new federal enterprise bargaining agreements mostly fluctuated around 4 per cent over the decade. However, that measure has declined since 2008 to be around 3.5 per cent in the September quarter 2009.
Chart 3.7: Measures of nominal wage growth, annual
Note: All data are in seasonally adjusted terms.
[Source: ABS, Labour Price Index, Australia, Mar 2010, Catalogue No. 6345.0; ABS, Average Weekly Earnings, Australia, Feb 2010, Catalogue No. 6302.0; and DEEWR, Trends in Federal Enterprise Bargaining, September quarter 2009, http://www.workplace.gov.au.]
[114]
Unit labour costs take into account both the wage costs and productivity of labour. Nominal unit labour costs measure the average cost of labour per unit of output in current dollar values. Real unit labour costs adjust for inflation. A positive growth in real unit labour costs suggests that cost pressures exist as real wages rise faster than productivity. Real unit labour costs declined for most of the past decade.
Chart 3.8: Unit labour costs, annual growth rates
Note: All data are in seasonally adjusted terms.
[Source: ABS, Australian National Accounts: National Income, Expenditure and Product, Australia, Dec 2009, Catalogue No. 5206.0.]
Labour market
[115]
Employment and aggregate hours worked increased throughout most of the decade. Aggregate hours worked peaked in October 2008 and reached a recent low point in June 2009 before recovering. While annual employment growth was negative in some months during 2009, it has been growing since mid 2009. Employment grew by 2.5 per cent between June 2009 and April 2010.
Chart 3.9: Employment levels
[Source: ABS, Labour Force, Australia, Apr 2010, Catalogue No. 6202.0.]
[116]
Despite the recent economic downturn there was no significant decline in employment overall although full-time employment fell by almost 3 per cent (220 000 people) between July 2008 and August 2009. In contrast, part-time employment continued to grow.
Chart 3.10: Full-time and part-time employment levels
[Source: ABS, Labour Force, Australia, Apr 2010, Catalogue No. 6202.0.]
[117]
Table 3.1 shows employment to population ratios. The employment to population ratio has continued to fall since its peak in 2007. This is particularly apparent for males. At March 2010 the employment to population ration was 72.1 per cent.
Table 3.1: Employment to population ratio, total and by male/female (for people aged 15–64, all data in original terms)
|
|
Male
|
Female
|
Total
|
|
|
77.7
|
61.8
|
69.8
|
|
|
77.9
|
62.4
|
70.2
|
|
|
77.2
|
62.3
|
69.7
|
|
|
78.0
|
63.7
|
70.8
|
|
|
78.6
|
63.3
|
70.9
|
|
|
78.8
|
64.6
|
71.7
|
|
|
79.3
|
65.6
|
72.5
|
|
|
80.2
|
66.8
|
73.5
|
|
|
80.6
|
67.6
|
74.1
|
|
|
79.9
|
67.4
|
73.7
|
|
|
78.8
|
66.9
|
72.8
|
|
|
78.1
|
66.0
|
72.1
|
[Source: ABS, Labour Force, Australia,
Mar 2010, Catalogue No. 6202.0.]
[118]
Changes in employment tend to lag changes in GDP as the economy adjusts. The following chart shows the GDP growth rate decreasing from the second half of 2007 and the employment growth rate following this downward trend. The GDP growth rate increased in the December quarter 2009 while employment levels steadied.
Chart 3.11: Employment and GDP, annual growth rates
Note: All data are in seasonally adjusted terms.
[Source: ABS, Labour Force, Australia, Apr 2010, Catalogue No. 6202.0; ABS, Australian National Accounts: National Income, Expenditure and Product, Dec 2009, Catalogue No. 5206.0.]
[119]
The unemployment rate reached a low of 4.0 per cent in February 2008 after seven years of steady decline. It then increased to a recent peak of 5.8 per cent in July 2009. At April 2010 the unemployment rate was 5.4 per cent. The participation rate remained broadly unchanged in the first half of the decade, increased strongly between 2004 and 2007, and peaked in 2008. The participation rate has remained at relatively high levels.
Chart 3.12: Unemployment and participation rates
[Source: ABS, Labour Force, Australia, Apr 2010, Catalogue No. 6202.0.]
[120]
The unemployment rates for 15–24 year olds and lone parents have consistently been above the aggregate unemployment rate over the last decade. The trends for both groups have followed the aggregate unemployment rate, however, the unemployment rate for 15–24 year olds increased at a faster rate during the recent downturn.
Chart 3.13: Unemployment rates for 15–24 year olds and lone parents
Note: The series for lone parents began in April 2001 and is in original terms. Unemployment rates for 15–24 year olds and aggregate unemployment are seasonally adjusted.
[Source: ABS, Labour Force, Australia, Apr 2010, Catalogue No. 6202.0; ABS, Labour Force, Australia, Detailed
–
Electronic Delivery, Apr 2010, Catalogue No. 6291.0.55.001.]
[121]
The industries that experienced the largest average annual employment growth over the decade to February 2010 were mining (7.8 per cent) and electricity, gas, water and waste services (5.2 per cent). In contrast, employment growth declined in agriculture, forestry and fishing (–2.1 per cent) and information media and telecommunications (–0.7 per cent).
[122]
For award-reliant industries, employment growth over the decade was mixed. Health care and social assistance (3.7 per cent) and administrative and support services (2.3 per cent) exhibited above-industry average annual growth (2.1 per cent) over the decade. However, employment growth for accommodation and food services (1.5 per cent) and retail trade (2.0 per cent) were below average over the decade.
Chart 3.14: Average annual change in employment by industry, February 2000 to February 2010, percentage change
Note: All data are in seasonally adjusted terms.
[Source: ABS, Labour Force, Australia, Detailed, Quarterly, Feb 2010, Catalogue No. 6291.0.55.003.]
[123]
The annual average number of new jobs by industry over the decade is shown in Chart 3.15. This shows the industries in which new jobs are being created. Whilst the mining sector shows the highest growth in percentage terms (in the previous chart), it should be noted that growth in retail and other award-dependent industries has been greater in absolute terms.
Chart 3.15: Average annual change in employment by industry, February 2000 to February 2010, ‘000s
Note: All data are in seasonally adjusted terms.
[Source: ABS, Labour Force, Australia, Detailed, Quarterly, Feb 2010, Catalogue No. 6291.0.55.003.]
[124]
More recent growth in employment on an industry basis is shown in Table 3.2.
Table 3.2: Employment growth by industry, percentage change
|
|
Feb 2008–Feb 2009
|
Feb 2009–Feb 2010
|
|
Professional, scientific and technical services
|
–4.6
|
11.6
|
|
Administrative and support services
|
2.1
|
10.2
|
|
Wholesale trade
|
–3.6
|
9.7
|
|
Mining
|
19.4
|
5.7
|
|
Financial and insurance services
|
–1.7
|
5.3
|
|
Education and training
|
–1.2
|
4.1
|
|
Accommodation and food services
|
0.2
|
4.0
|
|
Health care and social assistance
|
4.5
|
3.1
|
|
Other services
|
–4.5
|
2.8
|
|
Public administration and safety
|
5.2
|
2.4
|
|
Construction
|
–0.5
|
0.4
|
|
Manufacturing
|
–5.5
|
–1.3
|
|
Agriculture, forestry and fishing
|
9.8
|
–1.6
|
|
Retail trade
|
–1.2
|
–2.9
|
|
Arts and recreation services
|
10.5
|
–6.3
|
|
Transport, postal and warehousing
|
10.4
|
–6.4
|
|
Rental, hiring and real estate services
|
–12.0
|
–6.8
|
|
Information media and telecommunications
|
–1.6
|
–7.3
|
|
Electricity, gas, water and waste services
|
29.3
|
–12.0
|
|
Total
|
0.6
|
1.6
|
[Source: ABS, Labour Force, Australia, Detailed, Quarterly, Feb 2010, Catalogue No. 6291.0.55.003.]
[125]
The industries that experienced the largest employment growth over the year to February 2010 were professional, scientific and technical services (11.6 per cent) and administrative and support services (10.2 per cent). In contrast, employment declined in electricity, gas, water and waste services (–12.0 per cent) and information, media and telecommunications (
–
7.3 per cent).
[126]
The majority of award-reliant industries experienced an increase in employment, with administrative and support services, and health care and social assistance exhibiting above-industry average growth both over the year and over the previous year. However, employment growth in accommodation and food services only outpaced the industry average in the latest year, while it declined in retail trade for both periods.
Outlook
[127]
The 2010–11 Budget noted that the world economy is in the early stages of recovery and is improving faster than had been expected. Growth is anticipated to remain uneven, with advanced economies expected to grow more slowly than emerging economies. Table 3.3 summarises the forecasts for world economic growth and growth in Australia’s major trading partners.
Table 3.3: 2010–11 Budget forecasts, international GDP growth
|
|
2008–09 (outcomes)
|
2009–10 (estimates)
|
2010–11 (forecasts)
|
2011–12 (forecasts)
|
|
World
|
3.0
|
–0.6
|
4-1/4
|
4-1/4
|
|
Major trading partners
|
2.6
|
0.0
|
4-3/4
|
4-3/4
|
Notes: (a) Percentage changes on previous year are shown.
(b) The economies in the major trading partners grouping are Brazil, Canada, China, the Euro area, Hong Kong, India, Indonesia, Japan, Malaysia, New Zealand, the Philippines, the Republic of Korea, Russia, Singapore, Taiwan, Thailand, the UK, the US, and Vietnam.
[Source: Australian Government, Budget Paper No. 1: Budget Strategy and Outlook 2010–11, Canberra, 2010, p. 2–7.]
[128]
The IMF updated its forecasts for economic growth in its April 2010 World Economic Outlook and these are presented in Table 3.4. Australia’s GDP growth is forecast to remain above the growth rate of the advanced economies in 2010 and 2011 but below world GDP growth.
|
|
2008
(outcomes)
|
2009
(outcomes)
|
2010
(forecasts)
|
2011
(forecasts)
|
|
Australia
|
2.4
|
1.3
|
3.0
|
3.5
|
|
Advanced economies
|
0.5
|
–3.2
|
2.3
|
2.4
|
|
World
|
3.0
|
–0.6
|
4.2
|
4.3
|
Note: Year-on-year percentage changes shown. Real GDP growth over the year to the December quarter 2010 is forecast to be 2.9 per cent rising to 4 per cent over the year to the December quarter 2011.
[Source: IMF, World Economic Outlook, April 2010, http://www.imf.org/external/pubs/ft/weo/2010/01/index.htm.]
[129]
Treasury, in 2010–11 Budget Statement 2, noted that the Australian economy slowed significantly in 2009 but outperformed other advanced economies in a year of unprecedented global economic turbulence. It attributed the relatively shallow domestic downturn to monetary and fiscal policy stimulus, noting that private sector activity is now gathering momentum. As to future economic prospects, Treasury said:
“While the global economic recovery is expected to be uneven, the outlook for the Australian economy is increasingly positive with strong prospects for the Asian region expected to support a rising terms of trade and a rebound in business investment.”
71
[130]
The Treasury Economic Outlook is reflected in the following table:
|
|
2008–09 (outcomes)
(b)
|
2009–10 (forecasts)
|
2010–11 (forecasts)
|
2011–12 (forecasts)
|
|
Demand and output
(c)
|
|
|
|
|
|
Household consumption
|
1.9
|
2¾
|
3½
|
4
|
|
Private investment
|
|
|
|
|
|
Dwellings
|
–1.9
|
3
|
7½
|
4
|
|
Total business investment
(d)
|
6.6
|
–2
|
7
|
12½
|
|
Non-dwelling construction
(d)
|
8.5
|
–7
|
8
|
14
|
|
Machinery and equipment
(d)
|
4.8
|
–½
|
6
|
13
|
|
Private final demand
(d)
|
2.3
|
1¾
|
4¼
|
6
|
|
Public final demand
(d)
|
4.3
|
7¼
|
1
|
–½
|
|
Total final demand
|
2.7
|
3
|
3¾
|
4½
|
|
Change in inventories
(e)
|
–0.9
|
¾
|
½
|
0
|
|
Gross national expenditure
|
1.8
|
3¾
|
4¼
|
4¾
|
|
Exports of goods and services
|
0.1
|
1½
|
5
|
6
|
|
Imports of goods and services
|
–2.8
|
5
|
9
|
8½
|
|
Net exports
(e)
|
0.6
|
–¾
|
–1
|
–¾
|
|
Gross domestic product
|
1.3
|
2
|
3¼
|
4
|
|
Non-farm product
|
1.0
|
2
|
3½
|
4
|
|
Farm product
|
17.6
|
6
|
1
|
2
|
|
Nominal gross domestic product
|
6.5
|
2¾
|
8½
|
5¾
|
|
Other selected economic measures
|
|
|
|
|
|
External accounts
|
|
|
|
|
|
Terms of trade
|
9.6
|
–3¾
|
14¼
|
–3¾
|
|
Current account balance (per cent of GDP)
|
–3.0
|
–4¾
|
–3¾
|
–5
|
|
Labour market
|
|
|
|
|
|
Employment (labour force survey basis)
(f)
|
0.1
|
2½
|
2¼
|
2
|
|
Unemployment rate (per cent)
(g)
|
5.7
|
5¼
|
5
|
4¾
|
|
Participation rate (per cent)
(g)
|
65.4
|
65¼
|
65½
|
65½
|
|
Prices and wages
|
|
|
|
|
|
Consumer Price Index
(h)
|
1.5
|
3¼
|
2½
|
2½
|
|
Gross non-farm product deflator
|
5.5
|
1
|
5
|
1¾
|
|
Wage Price Index
(f)
|
3.8
|
2¾
|
3¾
|
4
|
Note: The forecasts are based on several technical assumptions. The exchange rate is assumed to remain around its recent average level – a trade-weighted index of around 70 and a United States dollar exchange rate of around 90 US cents. Interest rates are assumed to move broadly in line with market expectations. World oil prices (Malaysian Tapis) are assumed to remain around US$88 per barrel. The farm sector forecasts are based on an assumption of average seasonal conditions.
(a) Percentage change on previous year unless otherwise indicated.
(b) Calculated using original data.
(c) Chain volume measures except for nominal gross domestic product which is in current prices.
(d) Excluding second-hand asset sales from the public sector to the private sector.
(e) Percentage point contribution to growth in GDP.
(f) Seasonally adjusted, through-the-year growth rate to the June quarter.
(g) Seasonally adjusted estimate for the June quarter.
(h) Through-the-year growth to the June quarter.
[Source: Australian Government, Budget Paper No. 1: Budget Strategy and Outlook 2010–11, Canberra, 2010, p. 2-7.]
[131]
Treasury noted that the Australian economy grew by 1.4 per cent during 2009 – a full 4½ percentage points above the advanced economy average, with growth in non-farm GDP of 1.0 per cent in financial year 2009–10. It contends that the shallower downturn allowed Australia to largely avoid the business failures and large-scale employment losses that have occurred in many other countries.
[132]
The global economy is forecast to grow by 4¼ per cent in both 2010 and 2011, with stimulus measures continuing to support global growth this year. The Australian economy is forecast to grow by 3¼ per cent in 2010–11, rising to 4 per cent in 2011–12, with private sector activity expected to be the key driver of growth, as the Government’s fiscal stimulus is phased out and detracts from GDP growth.
[133]
Treasury forecast that:
“Improved external conditions should significantly increase demand for Australian exports, boosting the terms of trade and supporting a recovery in business investment.
Solid private sector growth, and continued labour market strength, should see the economy return to full employment more quickly than previously expected.”
72
[134]
Treasury notes risks to the Australian economic outlook within the global economy as advanced economies have to work through an extended period of financial sector balance sheet repair and fiscal consolidation, with concerns about fiscal sustainability having the potential to spill over from the European Union periphery to other highly indebted countries and financial markets more broadly. It also noted a risk of inflationary pressures emerging in Asian economies, including China, with the erosion of excess capacity in those economies. On the positive side, Treasury noted the potential for the global economy to recover more strongly, with flow-on effects to the Australian economy.
[135]
The key features of the economic outlook described by Treasury are:
● the world economy, experiencing a nascent and uneven recovery with an ongoing disparity in growth forecasts between the advanced and developing world, is expected to grow by 4¼ per cent in both 2010 and 2011, led by a resurgence of growth in the developing Asian economies, but with a prolonged period of financial sector balance sheet repair and fiscal consolidation acting as a drag on recovery in the advanced economies;
● Australia’s real GDP is forecast to grow by 3½ per cent in 2010–11 and 4 per cent in 2011–12, driven by household consumption, business investment and exports;
● household consumption is expected to continue to recover, supported by a strong labour market, sustained improvements in consumer confidence and higher asset prices;
● dwelling investment is forecast to grow by 7½ per cent in 2010–11;
● business investment is expected to rise significantly in both 2010–11 and 2011–12;
● public final demand, having risen strongly in 2009–10, is forecast to moderate in 2010–11 and 2011–12, as the Government’s fiscal stimulus measures are unwound;
● both exports and imports are forecast to grow solidly in both 2010–11 and 2011–12, with import growth reflecting rising domestic demand and a strong Australian dollar;
● the terms of trade are forecast to rise in 2010–11 to their highest level in 60 years, largely due to strong price rises for Australia’s iron ore and coal exports, driven by a recovery in global demand. Commodity prices are expected to moderate somewhat in 2011–12, but still remain at high levels;
● the current account deficit is forecast to narrow in 2010–11, reflecting the improved terms of trade, before expanding to 5 per cent of GDP in 2011–12 in response to rising import volumes and a modest fall in the terms of trade;
● unemployment is expected to continue to fall, although with the decline moderated by rapid expansion in the labour force, with the unemployment rate reaching 5 per cent by the end of 2010–11 and 4¾ per cent by the end of 2011–12;
● employment is expected to grow by 2¼ per cent through the year to the June quarter 2011 and 2 per cent through the year to the June quarter 2012, with average hours returning to more normal levels over the course of 2010–11;
● the WPI is expected to grow by 3¾ per cent through the year to the June quarter 2011 and 4 per cent through the year to the June quarter 2012.
There is upside risk to wages growth in industries and regions associated with the resources sector;
● underlying inflation is expected to stabilise at around 2½ per cent, although higher headline inflation is expected through the year to the June quarter 2010, due to a one-off ¼ of a percentage point contribution from the increase in the excise and excise-equivalent customs duty on tobacco products, before moderating to 2½ per cent through 2010–11 and 2011–12; and
● strong nominal GDP growth is expected to be broadly distributed throughout the economy, reflected in strong growth in compensation of employees, gross operating surplus and gross mixed income.
[136]
In May 2010, the RBA noted in its Statement on Monetary Policy, astronger than expected growth in the Australian economy over the past year, supported by stimulatory settings for fiscal and monetary policy, the rebound in Asia, and a high rate of growth in the population, with business conditions at above-average levels and employment growing solidly.
[137]
The RBA also noted:
● improving conditions in the world economy, with strong growth in Asia, recovery in North and South America, with weak activity across the euro area. Its domestic forecasts were based on an expectation of growth in global output of just under 4½ per cent in year-average terms in 2010, slowing to around 4 per cent in 2011, with some withdrawal of policy stimulus in both the advanced and emerging economies. The growth forecasts are above the average rate of global growth recorded during the decade prior to the recent global downturn; and
● improved terms of trade, primarily due to higher prices for coal and iron ore, supported by an increase in demand from China as well as the ongoing recovery in demand from other trading partners such as Japan and Korea.
[138]
Against this international outlook, the RBA forecast continuing strong growth in the Australian economy, as shown in Table 3.6.
|
|
Dec
2009
|
June
2010
|
Dec
2010
|
June
2011
|
Dec
2011
|
June
2012
|
Dec
2012
|
|
GDP growth
|
2.7
|
2½
|
3¼
|
3¾
|
3¾
|
3¾
|
4
|
|
Non-farm GDP growth
|
2.5
|
2½
|
3¼
|
3¾
|
3¾
|
3¾
|
4
|
|
CPI inflation
|
2.1
|
3¼
|
3¼
|
3
|
2¾
|
3
|
3
|
|
Underlying inflation
|
3¼
|
2¾
|
2¾
|
2¾
|
2¾
|
3
|
3
|
Note: Percentage change over the year to the quarter shown. Technical assumptions include A$ at US0.91, TWI crude oil price at US$87 per barrel and Tapis crude oil price at US$90 per barrel.
[Source: RBA, Statement on Monetary Policy, May 2010, Table 14.]
[139]
GDP growth is forecast to increase to around 3¼ per cent over 2010 and around
3¾–4 per cent over the remainder of the forecast period, with strongest growth in the mining sector and the strength in the terms of trade having broad stimulatory effects on the economy. The forecasts reflect an expectation that the labour market will tighten gradually over the forecast period, with solid employment growth and a gradual fall in the unemployment rate.
[140]
Underlying inflation, having slowed to around 3 per cent over the year to the March quarter from a peak of just over 4½ per cent in September 2008, is forecast to ease further in the year to December 2010, reflecting an easing in wage growth, capacity utilisation and demand pressures in late 2008 and over 2009, as well as the substantial appreciation of the exchange rate since early 2009. Underlying inflation is then expected to gradually trend higher, to around 3 per cent in 2012, reflecting a gradual increase in capacity utilisation and demand pressures in the economy and some pick-up in wage growth as the labour market tightens.
[141]
The RBA forecasts were attended by the identification of risks, in both directions:
● On the downside:
● domestically, the fading of fiscal stimulus and the increase in interest rates to normal levels might have a larger effect on demand than has been incorporated in the forecasts;
● gradual fiscal consolidation to address rising public debt ratios in a number of advanced economies may dampen global growth in the medium term and commodity prices; and
● rising inflation in Asia may prompt a significant tightening of financial policies in the region.
● On the upside:
● the surge in commodity prices may have a greater effect on demand than assumed in the forecasts, raising the possibility of capacity constraints emerging and wages accelerating more quickly than currently expected, more likely in 2011 rather than 2010; and
● internationally, global economic growth may again be stronger than expected.
[142]
Indicators of future labour market activity include the ANZ Job Advertisement Series and the DEEWR Monthly Leading Indicator of Employment.
[143]
The ANZ Job Advertisement Series
found a 1.2 per cent decrease in total job advertisements (including both newspaper and internet advertisements) in April 2010 compared with March 2010 but 14.9 per cent higher than April 2009. Total job advertisements were 28.3 per cent above the cyclical low in July 2009.
[144]
The DEEWR Monthly Leading Indicator of Employment
is compiled using a combination of economic and employment indicators such as job advertisements, employment expectations, an index of economic activity and consumer sentiment. After decreasing for four consecutive months, the Indicator increased in May 2010.
Chart 3.16: DEEWR Monthly leading indicator of employment
[Source: DEEWR, Monthly Leading Indicator of Employment, May 2010, http://www.workplace.gov.au/workplace/
Publications/LabourMarketAnalysis/LeadingIndicatorEmployment/DEEWRMonthlyLeadingIndicatorofEmployment-LatestRelease.htm.]
Conclusion
[145]
Official forecasts indicate that the Australian economy will continue to recover strongly from the GFC-related slowdown in 2009 over the remainder of 2010, and into 2010–11 and 2011–12. Both Treasury and the RBA expect real non-farm GDP to resume growth at levels approaching 4 per cent in 2010–11 and 2011–12, from a level of 2–2½ per cent in 2009–10, with growth driven by private sector consumption and investment and supported by a favourable terms of trade, particularly in 2010–11. The strong growth in output is expected to be reflected in the labour market, with employment growth at or in excess of 2 per cent per annum, average hours returning to more normal levels, increasing participation rates and a reduction in unemployment, notwithstanding an expansion in the labour force. Strong growth in nominal GDP will support increased compensation of employees, gross operating surplus and gross mixed income. Aggregate wages growth is expected to return to more normal levels, with the passing of the GFC-related slowdown in economic activity and inflation is expected to remain within the RBA medium-term target range for underlying inflation over the next two years.
[146]
Treasury and the RBA identified risks associated with their forecasts, both upside and downside, and employer bodies highlighted some of those risks in their submissions to us. We think it inappropriate to assume the worst possible outcome in respect of those risks, although we do have regard to them, amongst other matters, in undertaking our task.
[147]
Overall, Australia’s immediate economic outlook is positive, with official forecasts suggesting a resumption of strong growth in economic activity and further steady inroads into unemployment in the context of relatively stable aggregate wages and prices growth.
4. A Fair and Relevant Safety Net
[148]
The minimum wages objective requires us to establish and maintain a safety net of fair minimum wages. The modern awards objective requires us to ensure that modern awards, together with the National Employment Standards (NES), provide a fair and relevant minimum safety net of terms and conditions. We shall deal first with some views concerning the minimum wages objective.
[149]
Submissions suggested various approaches to achieving fairness. The Australian Government submitted that the minimum wages objective emphasises fairness as a key principle. It listed social inclusion, relative living standards and needs of the low paid as being the “considerations of fairness” (whereas some of the other parameters – employment growth, productivity, and inflation – were considered to be the “economic factors”).
[150]
The New South Wales, Queensland, South Australian and Victorian Governments all argued that a safety net of fair minimum wages should take into consideration economic factors as well as the incomes of workers who are reliant on minimum wages.
[151]
Several submissions argued that setting fair minimum wages requires taking into account the wages and employment standards of employees who are not award-reliant. The Queensland Government submitted that “FWA is bound to ensure a wage outcome … that ensures those unable to bargain are not left behind”.
73
The Victorian Government argued that “… the overriding objective of a fair and effective safety net is to provide fair minimum employment standards that reflect the general expectations of the Australian community”.
74
The ACTU submitted that “fair minimum wages must have regard to wages paid generally”.
75
WiSER summarised the discussion from Austen (2003), on what forms of wage disparity are viewed as fair or legitimate. WiSER argued that a wage decision which helped to restore wage relativities and reduce wage inequality would be consistent with the approaches to fairness identified in Austen (2003).
76
[152]
ACCER defined a fair minimum wage as “one that provides a decent standard of living”,
77
while the Australian Government submission also made reference to a fair wage in this context.
78
The New South Wales and Queensland Governments both submitted that providing fair minimum wages involves maintaining the real value of minimum wages.
[153]
In relation to the concept of a safety net, both Ai Group and ACCI argued that minimum wages are part of a broader safety net that includes the tax/transfer system, and therefore the latter should be considered in determining the level of minimum wages. Both submissions pointed out that the Australian Industrial Relations Commission (AIRC) and AFPC took into account tax and transfer changes in previous wage reviews. ACCI also claimed that
“… this is what Parliament intended, as the concept of the safety-net has not changed in the Act
”.
79
In reply, the ACTU claimed that “[a]n examination of the former provisions with the current provisions shows this is not the case”.
80
ACCER also contested this interpretation.
[154]
The South Australian Government submitted that “wages represent only one component of the income safety net for Australians”, but also that any decision to over-emphasise other elements of this safety net could lead to a decrease in the real value of minimum wages and have a negative effect on the incentives to seek employment. It also noted that measures (such as tax cuts) “which operate to supplement the incomes of the low-paid, are shaped by social and economic policy considerations, which … diverge from the key industrial concerns of wage equity and an equitable wage safety net”.
81
[155]
In relation to the modern awards objective, the ACTU argued that the addition of the term “relevant” imposes a requirement when considering the variation of modern award wages to:
“… ensure that minimum wages (and conditions) in modern awards are maintained at a level which ensures that they are a not only a relevant safety net for agreement free employees, but continue to act as a relevant benchmark to underpin enterprise bargaining. The Panel must have regard to movements in rates of pay in the market - both in agreements and in aggregate measures.”
82
[156]
The Queensland Government supported the view that the addition of “relevant” in the objective imposed a requirement to consider general wage outcomes. However, in reply to that view, ABI submitted it was important:
“… in maintaining the relevance of the safety net, that the minimum wage should not increase at a rate that would have a negative impact on the capacity to achieve fairness and productivity gains through promoting bargaining, as required under … the modern awards objective.”
83
[157]
In relation to a minimum safety net of terms and conditions in modern awards, CCIWA and HIA both argued that changes to the safety net resulting from the introduction of the Fair Work Act should be taken into account in the current review. CCIWA noted that the Fair Work Act includes new provisions for the low paid to access improved wages and conditions (and equal remuneration orders), while HIA noted that the NES provide for safety net entitlements that are in addition to those that were previously available under the Australian Fair Pay and Conditions Standard (AFPCS). ABI, in its submission in reply, claimed that “the maintenance of the safety net is not reliant on sizable minimum wage increases, and is the product of the existence of the [National Employment Standards] and the mandatory four yearly reviews of modern awards”.
84
[158]
Some parties referred to the desirability of maintaining the value of minimum wages at the higher award levels and pointed to the compression of award relativities which results from flat dollar increases. During consultations, the ACTU claimed that the fall in the real value of the higher award classification rates of pay had reduced their relevance to market rates of pay, but that, nevertheless, “the relevance of minimum wages at all points of the classification scale remains”.
85
[159]
Ai Group submitted that relevance is linked in with the concept of the award system as a safety net, and that in this context the compression of relativities in award rates of pay is not problematic.
86
ACCI submitted that relevance refers to award rates of pay being capable of meeting the broad requirements for those rates of pay set out in the Fair Work Act, but claimed that annual wage reviews are not the only process available for ensuring that relevance.
87
Despite these submissions it appears to us that the compression of award relativities is significant when considering the requirement in the modern awards objective to provide a “relevant” safety net. We shall return to this issue later.
[160]
As noted already, the statutory scheme relating to minimum wages and modern awards differs significantly from the scheme which the AFPC was required to apply. The submissions recognise these changes and we have taken them all into account. The significance of these changes is considered further in dealing with criteria which are specifically identified in the minimum wages and modern awards objectives.
5. Relative Living Standards and the Needs of the Low Paid
Definitions of low paid
[161]
The minimum wages objective and the modern awards objective both require us to take into account relative living standards and the needs of the low paid.
[162]
Submissions put forward various views on how “low paid” employees should be defined. The Australian Government presented information on the incidence and characteristics of low paid employees, which it defined as “those employees earning up to two-thirds of median hourly earnings [for full-time employees]”.
88
The Victorian Government cited information that it had provided for previous wage reviews on the characteristics of low paid workers, which it had defined as employees earning up to $700 per week.
[163]
The ACTU stated that its position was that “all minimum wage workers are low paid”.
89
ACCER, taking what they claimed to be a broad view, said that it would include “those who are below what may be described as a ‘modest’ … standard of living”.
90
[164]
ACCI recommended a tiered increase in minimum wages, on the basis that this most properly accorded with the role of minimum wages as a safety net for the low paid. It suggested increases to minimum wages should be higher for those earning up to and including the level of the C10 classification rate.
[165]
The Western Australian Government submitted “that there is no straightforward definition of what constitutes ‘low paid’ for the purposes of minimum wage adjustments”.
91
It noted that one approach is to use award/minimum wage coverage as a proxy for identifying the low paid. It also noted that, “[f]or research purposes, low paid is usually defined in relation to the distribution of earnings – often two-thirds of the median adult ordinary time earnings”, but that “this approach does not consider whether earnings are adequate to support a low paid person’s needs”.
92
[166]
The Western Australian Government’s submission presented the results of research in which a low paid employee was defined as earning less per hour than 120 per cent of the hourly Federal Minimum Wage (FMW) (and also less per week than 120 per cent of the weekly FMW). ACOSS presented the results of research which focussed on the characteristics of both employees earning below the hourly FMW and employees earning up to $2.20 per hour above the FMW, and research which focussed on the characteristics of employees earning within 10 per cent of the FMW.
Incidence and characteristics of low paid employees
[167]
According to the August 2008 ABS Employee Earnings and Hours
(EEH) survey, 16.5 per cent of non-farm employees were paid the rate of pay specified in the relevant award.
93
Based on the total number of employees counted by the survey, this equated to 1 454 000 employees.
[168]
Using the EEH data, the Australian Government noted that women, part-time employees and private sector employees are more likely to be award-reliant.
[169]
The ACTU noted, using the same data, that the average weekly earnings of all non-managerial employees paid the award rate of pay (including part-time workers) was only slightly more than half the earnings of other employees, and that average hourly rates of pay for award-reliant employees were also significantly lower than for other employees. Distributions of hourly ordinary-time earnings for various types of employees receiving minimum (award) rates of pay showed that:
“… in May 2006, for adult employees receiving minimum rates of pay the ‘peak’ of the distribution was around what was then the value of the basic tradesperson’s (C10) rate.”
94
[170]
Using the definition of low paid employees as those employees earning up to two-thirds of median hourly earnings for full-time employees, the Australian Government showed that, as with employees earning award rates of pay, employees are more likely to be low paid if they are: women, part-time, in the private sector, in service industries and low-skilled occupations. Results presented by submissions that used other definitions of low pay were broadly similar.
[171]
Again using the definition of low paid employees given above, the Australian Government showed that, according to 2007 data from the Household, Income and Labour Dynamics in Australia
(HILDA) Survey, 38.1 per cent of low paid workers were in the bottom three deciles of the household income distribution for households with employees, and 19.4 per cent were in the top three deciles. The ACTU submitted that “[a]rguments that low paid employees reside predominantly in higher income households are not supported by the data”.
95
It used as evidence data from Healy and Richardson, which showed that more than two-thirds of those employees aged 21 years and over who were earning up to $2.20 above the FMW were in the bottom half of the household income distribution for households with adult employees. However, Ai Group pointed out that “many low-paid people are members of households where total disposable income is not low”.
96
Ai Group suggested in its reply submission “the corollary of the ACTU’s data is that a full one-third of low-paid employee households are found in the top half of the income distribution”.
97
[172]
Healy, using data from the ABS Survey of Income and Housing 2003–04, found that the employees likely to benefit the most from minimum wage adjustments do not receive much of their income from sources outside of the labour market. He also found that these employees are, in half of all cases, the highest or only wage-earner in their household.
Relative living standards
[173]
ACOSS submitted that it is significant that the minimum wages objective emphasises “relative” living standards:
“The quality of people’s living standards can only be properly assessed relative to what the community defines as adequate, which depends in turn on typical living standards in the community …”
98
[174]
The ACOSS submission also points to the variable nature of what might be considered acceptable living standards, stating that “[m]inimum acceptable living standards vary over time and in different countries, and [rise] along with general improvements in household incomes”.
99
[175]
In relation to relative living standards the ACTU’s submission quoted the ABS:
“The concept of living standards is a relative one:; a person’s living standards – whether they are rich or poor – is assessed relative to those of other people or relative to some statement of minimal needs.”
100
[176]
ABI argued that relative living standards can be maintained “by increasing real wages over time”.
101
In contrast ACCER claimed that “[t]he maintenance of real wages is a necessary condition, but it is not a sufficient condition for the effective operation of a safety net wage”.
102
However both parties agreed that the concept of relative living standards reflects the notion of social equity.
[177]
Several parties emphasised that adjustments to minimum wages can make a contribution to relative living standards.
103
The Australian Government submitted that minimum wage increases can help “in narrowing the earnings dispersion and thereby the relative position of low paid workers”.
104
[178]
In its submission in reply, Ai Group claimed that the ABS’ Household Income and Income Distribution
release “provides the most comprehensive analysis of changes in relative living standards for Australia”. Ai Group challenged the argument “that the relative living standards of low income Australians has worsened over the past couple of decades” by citing the ABS’ finding that there was “no significant change in income inequality from the mid 1990s to 2005–06”.
105
[179]
Healy noted that there are relatively few measures associated with living standards that are not affected by compositional change (such as a shift in the labour market towards higher-skilled jobs). He claimed that, where comparisons with measures do not control for compositional change, the evidence consistently shows award-reliant workers losing ground in relative terms. He cited the CPI and the Labour Price Index (which reflects movements in both the WPI and non-wage labour costs) as two indicators that were unaffected by compositional change, and his conclusions about the “fairness” of the wages safety net were guided most by these indicators.
[180]
A number of submissions indicated that in addressing “relative living standards” consideration should be given to general wage movements and the widening disparities in wages between workers reliant on minimum wages and other groups. Some of these submissions referred to the consequences of wage disparity. The New South Wales Government argued that:
“Wage inequality exacts a large toll on the low paid and their dependents. If minimum wages are set too low, the associated poverty can add costs to the broader community by way of increased health and welfare expenditure.”
106
[181]
ACOSS submitted that “[w]age inequality has a major impact on the overall inequality of income among households”.
107
[182]
The Australian Government submitted that the relative value of the FMW can be assessed by reference to the minimum wage “bite” – defined as the ratio of the adult minimum wage to full-time median earnings. It noted that:
“… there has been a steady decline in the minimum wage bite from 61.9 per cent in 1997 to 54.4 per cent in 2008 (latest data). This decline is due to full-time median earnings increasing faster than the FMW (72.1 per cent compared with 51.3 per cent in nominal terms) over the period.”
108
[183]
The Australian Government submitted that the minimum wage “bite” held at 54.4 per cent between 2008 and 2009 as there was no change in the FMW or median earnings for full-time employees in 2009. The Australian Government also submitted that there was a widening disparity in earnings, over the past two decades, between what it called the “high-paid” (those employees in the 90
th
percentile of the earnings distribution, or P90), those employees on median earnings (the 50
th
percentile, or P50), and the “low paid” (those in the 10
th
percentile, or P10). It noted that:
“
While those at P90 earned 1.55 times median earnings in 1988, they earned 1.74 times median earnings in 2008.
● The ratio of earnings of P90 to P10 has increased at a faster rate, from 2.19 in 1988 to 2.72 in 2008.
● The ratio of median earnings (P50) to the earnings of the low paid (P10) has increased at a slower rate from 1.41 in 1988 to 1.57 in 2008.”
109
[184]
Submissions provided data showing declines in the value of minimum wage rates relative to a range of earnings and wage measures and across a range of time spans. Focusing on the period from the March quarter 1999 to 2010, full-time adult AWOTE and full-time adult average weekly earnings (AWE) increased at faster rates than the C14 and C10 classification rates and the WPI increased at a faster rate than the C10 classification rate. (Chart 5.1).
Chart 5.1: Growth in C14 and C10 relative to AWOTE, AWE and WPI, 1999–2009, cumulative percentage change
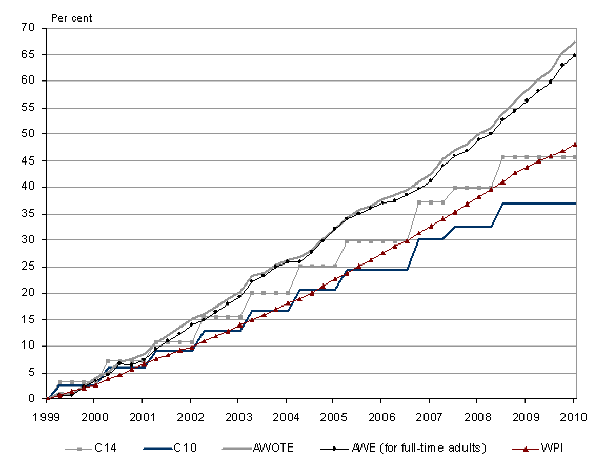
Note: This chart reflects data for the period March quarter 1999 to March quarter 2010. AWOTE and AWE for full-time adults are measured at mid-month of the quarter and are seasonally adjusted estimates. WPI is the index for total hourly rates of pay excluding bonuses in both private and public sectors and is a seasonally adjusted estimate.
[Source: ABS, Labour Price Index, Australia,
Mar 2010, Catalogue No. 6345.0, Table 1, Canberra, 2010; ABS, Average Weekly Earnings, Australia,
Feb 2010, Catalogue No. 6302.0, Table 2, Canberra, 2010; Metal, Engineering and Associated Industries Award 1998.]
[185]
In its submission in reply, the ACTU expressed concern about ACCI’s proposal of a “tiered approach” to adjusting minimum wages because “[s]uch an approach would substantially erode the relativities between classification levels in awards”.
110
[186]
In terms of measuring aggregate wage trends, the Australian Government contended that “[t]he stability of the WPI relative to other measures, such as Average Weekly Earnings, makes it the preferred indicator of wage trends for the ABS and the Reserve Bank of Australia …”.
111
ABI supported this view submitting that “AWOTE reflects compositional changes in the Australian workforce”, and therefore the “gradual transition over time towards jobs which are more highly skilled, more productive, and therefore more highly paid”.
112
[187]
In contrast, ACCER submitted that:
“… the WPI and other similar indexes used by the ABS are not designed to reflect the payments received across the workforce or in segments of it, but ‘to identify and measure quality and quantity changes and ensure that only pure price changes are reflected in the indexes’ … On the other hand AWOTE and similar measures actually reflect levels of remuneration received by employees and changes in those levels. These measures are particularly useful in describing what is happening in the workforce and are needed because the legislation requires that regard is to be had to relative living standards.”
113
[188]
ACCI contended that “[p]rivate sector wages better reflect the underlying strength of the labour market and the capacity of businesses to bear the cost of higher minimum wages”.
114
ABI also preferred the private sector WPI to the overall measure, as it claimed public sector wages “are not directly linked to productivity improvements, and are only marginally impacted by changes in economic conditions”.
115
ABI noted that the percentage increase in the private sector WPI over the past decade was similar to the percentage increase in the FMW; although the ACTU countered that the percentage increase in the FMW over this period was actually less than the private sector WPI, and that the percentage increases in other award rates were even lower.
[189]
Submissions compared movements in minimum wages with other wage measures. For example ACCER noted that “[i]n 2008 the unweighted average of the State rates was $7.19 per week more than the FMW” and that in 2009 this difference was $21.19 per week. A number of submissions drew attention to the disparity between award rates and wage outcomes achieved through bargaining and other methods of pay setting. The ACTU submission, using data from the EEH survey on the earnings of full-time non-managerial employees, showed that between 2000 and 2006 the ratio of median earnings for award-reliant employees to that of all employees fell from 79 per cent to 75 per cent. However, this ratio had fallen to 69 per cent by 2008. The ACTU submitted “that the decision not to increase minimum wages in 2009 will exacerbate this trend”.
116
ACCI submitted that published data on wages outcomes under federal enterprise bargaining agreements for September 2009 (published by DEEWR) showed “a considerable moderation in the wage increases being agreed to under these instruments … with both private and public sector outcomes having eased considerably at 3.6 and 3.5 per cent, respectively”.
117
[190]
Healy argues that part of the reason as to why award-reliant employees receive lower wages than employees covered by agreements is that award-reliant employees tend to work in “low-skilled” occupations. Using data from the May 2006 EEH survey, he estimated the wage differential between award-reliant and agreement-covered employees, after adjusting for other factors likely to affect their respective rates of pay, including their occupation, sex and whether they were employed on a permanent or casual basis. His results showed that, after adjusting for these differences in characteristics, award-reliant employees still earned significantly less than agreement-covered employees ($2.60 per hour less than workers on individual agreements and $4.20 per hour less than workers on collective agreements).
118
[191]
Several submissions provided comparisons of minimum wages in Australia with those in other countries within the context of comparing living standards. The Australian Government submission stated that the Australian minimum wage bite is high among OECD countries, although it also noted that it had declined in recent years. ACOSS submitted that:
“… Despite our relatively high minimum wages, the proportion of Australian employees who are low paid (defined in this case as earning less than two thirds of median full time wages) is close to the median of 15 countries recently surveyed by the OECD … One possible explanation for the difference [is that] a high proportion of Australian employees earn wages that are below or just above the minimum.”
119
[192]
ABI submitted that “… in 2005, Australia ranked 4th among 21 OECD countries when comparing the after tax value of the minimum wage with the after tax value of average wages”.
120
The ACTU argued in reply that it is not “relevant to compare living standards of Australians on minimum wages to those of minimum wages employees in comparable western countries” as “[t]he object of the Fair Work Act refers to ‘all Australians’”.
121
Real wages and the cost of living
[193]
The Australian Government noted that “cost of living increases have a bearing on the ability to maintain relative living standards and the needs of the low paid”
122
and that “there is a community expectation that wage increases, especially for the low paid, are sufficient to cover general cost of living increases”.
123
Many other submissions discussed recent and historical changes to the real value of minimum wages (usually meaning minimum wages adjusted for changes in the headline CPI), with several submissions drawing attention to the decline in the real value of minimum wages as a result of the AFPC’s decision to leave minimum rates of pay unchanged in 2009.
[194]
The Australian Government urged us to “grant a considered real increase in minimum wages that, at a minimum, reflects the cost of living increases since the last minimum wage rise” in 2008. However ACCI and Ai Group rejected the notion that there should be a “catch up increase”.
124
[195]
The Australian Government noted that since the establishment of the FMW in 1997, annual wage reviews have mostly determined real wage increases. They submitted that between the June quarter 1999 and September quarter 2009, the FMW increased by 2.3 per cent in real terms. ACOSS submitted that:
“The minimum wage fell in real terms over the 1980s and early 1990s, but rose moderately from the mid 1990s. As a result, its real value is approximately the same now as it was 20 years ago.”
125
[196]
While the real value of the FMW/C14 rate rose slightly over the past decade, award classifications including and above C10 have experienced a decline in their real value. ACCER noted the greatest falls in the real value of minimum wages occurred “at the higher end of the low paid spectrum”.
126
Between the December quarter of 1999
and the March quarter 2010, the C10, C4 and C1(b) classifications declined in real terms by up to 15.7 per cent while the C14 classification increased in real terms by 2.4 per cent (Chart 5.2).
Chart 5.2: Real value of selected minimum wage rates, December quarter 1999 to March quarter 2010
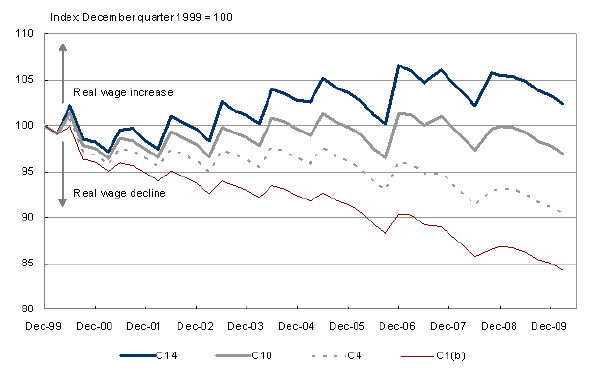
Note: Minimum wage rates are measured at end of quarter, except for the September quarters since 2007, which measure the minimum wage rates as of 1 October in each year.
[Source: ABS, Consumer Price Index, Australia, Mar 2010, Catalogue No. 6401.0, Canberra, 2010; Metal, Engineering and Associated Industries Award 1998.]
[197]
Submissions from the Australian, New South Wales and Victorian Governments suggested that particular attention be paid to large price increases in areas of basic need (e.g. housing, food, transport and utilities), given that low paid workers spend a greater share of their income on these items than other workers. The ACTU submitted that while growth in the CPI was moderate over the year to December 2009, it was largely due to a fall in the price of financial and insurance services, which is likely to make up a smaller proportion of expenses for low paid workers than for other employees. WACOSS also had concerns with using the CPI as an indicator of changes in living costs for low-income earners, given that “[p]rice movements in goods and services that form a small part of low-income earners’ budgets (for example, luxury goods and financial services) can offset price rises in vital goods and services such as food and housing”.
127
[198]
The Australian Government referred to the ALCIs for different household types produced by the ABS as the “conceptually preferred measures for assessing the effect of changes in prices on … out-of-pocket living expenses”.
128
The ACTU noted that between December 1999 and December 2009, the living cost index for employee households increased by 39 per cent, compared with an increase of 36.5 per cent in the CPI.
[199]
Several government submissions emphasised the importance of real increases for those employees earning minimum wages. The Australian Government’s position urged a “considered” real increase to minimum wages that “reflects the cost of living increases since the last minimum wage rise”.
129
The Queensland Government argued that to provide fair wages, real wages should not be reduced, while the Western Australian Government argued that the real value of the NMW and modern award wage rates should be maintained. The New South Wales Government submitted that a percentage increase would be necessary to maintain the real value of wages and that “[t]his will maintain relativities between the newly established wage classifications within modern awards”.
130
In contrast, ACCI submitted that:
“… There is no [legislative] presumption that changes in living standards as reflected by the CPI or other measures, requires a significant increase to minimum wages ‘to keep up’, or indeed outpace inflation. Offic[i]al and unofficial measures of inflation often fluctuate and are difficult to predict with any great accuracy over a period of time (let alone 12 months at a time) …”
131
Impact of the tax/transfer system on household disposable incomes
[200]
A number of submissions stated that factors beyond wages are relevant to addressing living standards and the needs of the low paid. Ai Group, for example, suggested that these factors “include wage rates, hours worked, continuity of employment and the family/household situation of low paid employees”.
132
In particular, many submissions contended that taxation and income transfers have an important effect on the relative living standards of workers reliant on minimum wages through their effect on household disposable incomes. For example:
“The tax-transfer system has an important role to play in minimising income inequality. The Government urges FWA to take into account ongoing tax and transfer policy initiatives which are aimed at supporting the incomes and therefore living standards of low paid workers.”
133
“Real disposable incomes are a function of nominal incomes and their interaction with the tax and transfer payments system. When determining the issue of providing a safety net for the low paid it is important the Commission have regard to factors beyond nominal incomes and take into consideration the impact of tax changes and increases in tax offsets, welfare payments, in-kind benefits and subsidies and any other measures that lift the after-tax incomes or living standards of the low paid.”
134
“The assessment of living standards of low income working families depends on wage levels, income taxation and family payments.”
135
[201]
Many employer and industry groups emphasised that the disposable incomes of minimum wage workers will be boosted by forthcoming changes to personal tax rates and the Low Income Tax Offset (LITO).
136
From 1 July 2010, the following changes will take effect:
● the threshold at which the marginal tax rate increases from 15 per cent to 30 per cent will rise, from $35 001 to $37 001; and
● the LITO will increase from $1350 to $1500 (and will continue to be reduced by 4 cents for every dollar of annual income over $30 000).
[202]
The Australian Government noted that as a result of these changes taxpayers will not pay income tax in 2010–11 until their annual income exceeds $16 000, and the net pay of a worker on the NMW will increase by almost $3.00 a week (or $150 in annual terms). ABI submitted that the net benefit of the tax changes for those earning between $37 000 and $63 000 will be around $8.65 per week. In reply, the ACTU submitted that the change to marginal tax rates will not benefit C14 and C10 employees (who earn less than $35 000 per year) and that the LITO increase will be of “some assistance … but it must be noted that only half of the increase in LITO comes in regular pay; the other half is accessible following the lodgement of a tax return”.
137
[203]
The Ai Group submission also noted that, effective from 1 July 2010, there will be increases to the nominal value of transfer payments and the income tests that apply to those payments. It claimed that the contribution of these transfer payments to the disposable income of households with children can be “very significant”:
“The degree depends on the number and age of children, eligibility for [Rent Assistance] and [Family Tax Benefit Part B]. For a single income household, living in rental accommodation and earning a wage of $550 per week, [Family Tax Benefit Part A and B and Rent Assistance] combined would make up over 38% of household disposable income.”
138
[204]
While the ACTU and the Australian Government both noted the upcoming tax/transfer changes, they argued that the tax/transfer system should be complementary to minimum wages in meeting the needs of the low paid rather than being a substitute for them:
“Increases in the real value of income support payments and tax cuts have an impact on the disposable income of award minimum wages workers. However, tax and transfers do not substitute for wages increases. The wages, tax and transfer systems have a complementary role to play in assisting meeting the needs of the low paid.”
139
“The Government acknowledges, however, that neither policy lever – minimum wages or the tax-transfer system – is sufficient on its own to address increasing inequality. Both levers must work in a complementary fashion to create an effective safety net for the low paid.”
140
[205]
The ACOSS and ACCER submissions also made this point. Further, ACOSS suggested that, in a fiscal environment of “consolidation” with no scheduled program of large tax cuts, and with Family Tax Benefits for low-income families only being indexed to prices (rather than to average earnings), this “shifts the responsibility for sustaining the ‘relative living standards and the needs of the low paid’ back to minimum wages …”
141
[206]
The Australian Government submission showed that there were real increases in disposable incomes over the last five years for a variety of households reliant on combinations of the then FMW and income transfers (Table 5.1). It also noted that as the FMW increased “only slightly in real terms over this period by around 0.5 per cent”, these increases to household income resulted largely from changes to the tax/transfer system.
Table 5.1: Change in real disposable income by selected FMW reliant household types 1 January 2005 to 1 January 2010
|
Household type
|
Change
%
|
|
Single person (age 21–54)
|
8
|
|
Single income couple (ages 21–54). Income support is Newstart allowance
|
14
|
|
Two income couple (both FMW).
|
8
|
|
Two income couple (both 50% of FMW). Income support is Newstart allowance
|
13
|
|
Single parent (age 21–54; child age 2). Income support is parenting payment
|
11
|
|
Single income couple (ages 21–54; child age 2). Income support is parenting payment
|
13
|
Note: Unless indicated otherwise, the households are all assumed to have private incomes equal to the FMW.
[Source: Australian Government submission at p. 86, Table 5.9; DEEWR modelling (as amended at consultations).]
Needs of the low paid
[207]
Few submissions attempted to provide an authoritative definition of “the needs of the low-paid”. The Australian Government referred to “the importance of minimum wages in addressing the needs of the low paid”, in that “increased minimum wages boost wages for some workers, which may flow through to increase household spending and thereby support jobs”.
142
However, no further definition was provided.
[208]
The Western Australian Government urged caution in adopting a one-size-fits-all definition of “needs”:
“… definitions that focus on a needs-based approach assume all low paid workers have the same pre-defined lifestyle. These definitions do not take into account variables such as household income, assets and individual family circumstances.
Given the difficulty in developing a robust definition of needs for low paid employees, the Minister submits that FWA should not limit itself to any one perspective when considering minimum wage adjustments.”
143
[209]
Similar positions were adopted by ACOSS and ABI:
“Income poverty is only an indicative measure of family living standards, since families may have different expenditure needs (for example, better health care) and different assets at their disposal (for example savings).”
144
“Discussions around the needs of the low paid will invariably require a subjective assessment of what constitutes a need, and definition of what constitutes poverty. There are a number of inherent difficulties associated with making such an assessment, not the least of which is that fact that different people will be facing different household circumstances and therefore different needs.”
145
[210]
The ACTU and ACCER, however, provided more comprehensive definitions of the term “needs”:
“Employee needs are met when they have an income sufficient to participate in and to belong to Australian contemporary society; a standard that facilitates social inclusion for minimum wage workers.”
146
“The needs of the low paid may be described in broad or qualitative terms, such as: the need to live in modest comfort, to live with dignity, to receive a living wage, and to live above without poverty.”
147
[211]
ACCER also emphasised that the needs of low paid workers include the needs of those who are financially dependent on them, namely, their families:
“ACCER submit that a NMW should be set at a level that would enable a worker, with the assistance of family payments, to support a family of two adults and two children at a decent standard of living.”
148
[212]
ACOSS expressed a similar view:
“The FMW should not be directly designed to cover the cost of children because that role is best performed by the social security system. However, the FMW together with family payments should be sufficient to prevent a family from falling into poverty.”
149
[213]
However, unlike ACOSS, ACCER clearly did not support the adoption of a single-person test for the adequacy of the NMW as the “needs of workers include the needs of their families”.
150
[214]
The ACTU submitted that “[s]ignificantly, the FW Act couples ‘relative living standards and the needs of the low paid,’ which reinforces the notion that the needs of the low paid are not fixed, but are relative”.
151
Living standard benchmarks and measurements
[215]
A number of submissions cited commonly-used definitions and measurements of poverty. However, there is little consensus as to what constitutes an appropriate benchmark of adequacy. Identified benchmarks included:
● the Henderson poverty line (HPL);
● poverty lines expressed as a proportion of overall average or median household disposable income;
● indicative “Budget Standards” developed by the Social Policy Research Centre in the mid 1990s; and
● financial stress indicators.
[216]
The HPL is an estimate of household income below which a household is considered to be in poverty. It uses equivalence scales to adjust the line for different household and family types. HPLs were first developed in 1964 as part of a study of poverty in Melbourne undertaken by a group of researchers (under the direction of Professor Ronald Henderson) from the Institute of Applied Economic and Social Research and have been updated quarterly since the Commission of Inquiry into Poverty in 1973. HPLs were widely used in Australian research into poverty throughout the 1980s and 1990s.
152
[217]
Poverty lines can also be expressed as a proportion of overall median or average (mean) household disposable income. Commonly-used poverty lines are 50 or 60 per cent of median income; and 50 per cent of mean income. Poverty lines based on median income link the concept of poverty to what is happening in the middle of the income distribution while poverty lines based on mean income link it to the average income across the population as a whole. These types of poverty comparators are now commonly used in Australia; and in international comparisons.
153
[218]
The “Budget Standards” approach estimates what is needed, in terms of material goods and services, by a particular type of family to achieve a particular standard of living in a specified location.
154
This method articulates a standard of living in terms of consumption and activity patterns, and specifies the needs that must be met in order to maintain that standard. It then identifies and prices the basket of goods and services required to meet those needs; thereby producing the total family budget needed to achieve that particular standard. Two separate indicative budget standards were developed by the Social Policy Research Centre in 1997: a “low-cost” standard and a “modest but adequate” standard.
[219]
The financial stress approach conceives of poverty as a state of deprivation. There are a number of different components of financial stress: such as being unable to pay bills on time, missing meals or asking for help from community or welfare organisations. Such questions have been included in a number of ABS surveys, and annually in the longitudinal HILDA survey, in order to ascertain how many Australian households experience financial stress or material deprivation.
[220]
The ACTU’s submission focussed on research examining the number of households with disposable income below poverty lines based on 50, 60 or 75 per cent of median household income:
“Payne uses a threshold for income poverty at 50 per cent of median equivalised disposable income. Payne finds that the rate of poverty among households with at least one employee persisted at roughly 3 per cent over the period 1997 to 2006 …
Saunders et al, using a 60 per cent poverty line for 2005-2006 find a poverty rate of 14.5 per cent for households with one earner and a poverty rate of 3.6 per cent for households with two earners.”
155
“Utilising a less austere 75 per cent of median equivalent disposable income of all households threshold to define ‘income poor’, Hahn and Wilkins find 6.7 per cent of all employees, or 28 per cent of all employees who are low paid, are low paid and poor. Hahn and Wilkins describe this group as a significant minority of low paid workers.”
156
[221]
The ACTU compared disposable income for a range of household types reliant on the C14, C13 and C10 classification rates relative to poverty lines representing 60 per cent of median household equivalised disposable income (for that household type). Its analysis, it claimed, showed that few of these selected household types had disposable income significantly above the relevant poverty line, while some had disposable income that was below the relevant poverty line (particularly where households were not eligible for Rent Assistance). For single-earner couple households (with and without children), disposable incomes tended to be close to or below the relevant poverty line (see, for example, Table 5.2).
Table 5.2: Disposable income of single earner, award-dependent renter households
|
|
|
|
|
|
|
|
|
|
|
60% median income PL
|
Disposable income $pw
|
Disposable income as proportion of poverty line
|
|
Renters
|
C14
|
C13
|
C10
|
C14
|
C13
|
C10
|
|
Household type
|
$pw
|
$pw
|
$pw
|
$pw
|
%
|
%
|
%
|
|
Single adult, no children
|
455.40
|
497.30
|
511.30
|
573.30
|
109.2
|
112.3
|
125.9
|
|
Single parent, one child
|
592.02
|
716.50
|
730.70
|
793.10
|
121.0
|
123.4
|
134.0
|
|
Single-earner couple, no children
|
683.10
|
679.70
|
685.60
|
711.50
|
99.5
|
100.4
|
104.2
|
|
Single-earner couple, one child
|
819.72
|
824.10
|
829.50
|
845.20
|
100.5
|
101.2
|
103.1
|
[Source: ACTU submission at p. 149, para. 11.41, Table 11.5; ACTU calculations, based on tax parameters as at 1 July 2009 and transfer payments as at March 2010.]
[222]
ACCER provided modelling to show the decline in the disposable income of an FMW-dependent family of two adults and two school-aged children. ACCER did not include Newstart Allowance for the second partner as it maintained that “parents should have the ‘effective’right to choose that one of them will stay out of the employed workforce in order to care for their children”.
157
Hence, their disposable income figures fall below each of the chosen benchmark comparators.
[223]
The issue of which benchmark (or benchmarks) constitutes the optimal measure of an adequate standard of living was covered in greatest depth by organisations such as ACOSS and ACCER. ACOSS recognised that a consensus is unlikely to be forged on the use of a single benchmark. Instead, it suggested that “a set of basic income benchmarks should be used as a guide in assessing the adequacy of minimum wages”.
158
[224]
With this in mind, ACOSS recommended consideration of:
● the Budget Standards approach, the main advantages of which, it claimed, are its transparency and adaptability. ACOSS identified some difficulties with this approach, including reliance on the judgment of experts as to which items should be included, and the need to update them. The original 1997 figures were deemed out-of-line with contemporary community expectations as to what constitutes a reasonable budget;
● financial stress indicators as collected by the ABS; and
● housing costs, as these constituted an increasing component of the household budget.
[225]
ACCER also favoured the Budget Standards approach:
“One of the advantages of the budget standards approach is that it provides critics with an opportunity to provide contrary evidence on costs, or to argue that items for the various baskets of goods are inappropriate. The opportunity to contest the items should be part of an ongoing inquiry by FWA into the needs of the low paid.”
159
[226]
ACCER rejected the HPL as “greatly underestimating the needs of working families”, especially in regard to the costs of housing and child care.
[227]
The ACTU’s submission included recent research findings on the prevalence of financial stress among low-income households:
“Watson … looks at HILDA Wave 5 (2005) data on financial stress for households at or below the C10 Tradespersons wage rate (2005:$15.94 per hour) and finds that those households have a higher level of experience of two or three or more episodes of financial stress than other employed households and all employed households.”
160
[228]
While recognising the issue of financial stress, ACCI emphasised that:
“The evidence also indicates that unemployed people have considerably lower levels of household income than people in low-paid jobs and are more likely to experience financial stress …”
161
Relationship between minimum wages and employment
[229]
As in previous wage reviews, submissions expressed significantly different views regarding the impact of any potential increase in minimum wages on employment. Some conflict is also evident in research on the topic. The Australian Government summarised the relevant research as follows:
“The majority of academic studies analysing the relationship between minimum wages and employment have found that increases in minimum wages have a negative relationship with employment, but there is no consensus about the strength of the relationship. There are however a number of studies that did not find a statistically significant relationship, and a small number that found positive employment effects.”
162
[230]
The Australian Government and the Victorian Government both submitted that, in the past, moderate increases in minimum wages have been associated with employment growth.
[231]
The ACTU submitted that:
“… regular, moderate and predictable minimum wages increases are … benign for employment. The international evidence is that ‘elasticities hover around zero’; in any event any employment impact of changes to minimum wages is swamped by other factors in a dynamic growing economy with continuing structural change.”
163
[232]
In contrast, ACCI warned against “creating wage levels that would discourage or exclude people from gaining employment.”
164
In its submission in reply, ACCI claimed that “[t]he strong consensus in the empirical literature is that increasing minimum wages will curtail the employment prospects of the low paid”.
165
[233]
Ai Group submitted that:
“In the presence of already-oversupplied labour markets, Ai Group maintains that it is appropriate to moderate rises in minimum wages in light of the risk that higher minimum wage levels will be associated with fewer alternative employment opportunities and/or fewer additional hours of work for part-time workers.”
166
“This is particularly the case when consideration is given to the risk that raising minimum rates of pay could have deleterious impacts on the employment of low-paid people.”
167
[234]
Some claims were made regarding possible links between previous minimum wage decisions and the current level of unemployment. CCIQ claimed that the AFPC’s decision to leave minimum rates unchanged in 2009 “materially” helped to keep Australia’s unemployment rate below official forecasts. The New South Wales Government submitted that:
“… while the increase in unemployment after June 2008 was largely attributable to the global financial crisis, at this point in time it cannot be ruled out that the cumulative impact of minimum wage rises between 2006 and 2009 may have contributed to the rising unemployment trend after early 2008.”
168
[235]
ACCI, in its submission in reply, cited the results of a supplementary question asked in its Survey of Investor Confidence, for which one in five businesses responded “that
the decision of the AFPC to leave minimum rates of pay unchanged had a positive impact on their ability to either maintain or increase levels of employment”.
169
[236]
ABI submitted that the negative employment effects of increasing minimum wages are likely to be amplified in the current economic climate.
Conclusions
[237]
There is no consensus among the parties and other commentators with respect to a definition of the low paid. Because there is a continuous distribution of wages, there is no wage threshold just below which people are clearly low paid and just above which people are clearly not low paid. Rather, the lower the wage, the more “low paid” is the employee. People earning above or near median earnings are clearly not low paid in an absolute sense. In considering relative living standards and the needs of the low paid, we have focussed mainly on those receiving less than two-thirds of median adult ordinary-time earnings (currently about $700 per week) and its equivalent hourly rate (about $18.50). We have also had regard in particular to those paid at the C10 rate, in recognition of past practice, on the C14 rate, which is equivalent to the minimum wage, and on those whose full-time equivalent wages put them in the bottom quintile of the wage distribution. Employees on award wages that are above these rates can be considered to be low paid in a different sense. The comparison here is between the award rate and the bargained rate for similar work.
[238]
Conclusions about trends in low pay depend upon the definition (as well as the data source) that is used. However the low paid are defined, the evidence that is available to us about these trends is limited. The proportion of employees earning the award rate of pay has fallen over time, with estimates showing this proportion decreasing from 67 per cent in 1990 to 33 per cent in 1995 to 23 per cent in 2000 to around 17 per cent in 2008.
170
We note that these data are derived from an indirect measure of award reliance, the EEH survey, and may understate the true position. With low pay defined as less than two-thirds of median earnings, the Australian Government showed that the incidence of low paid employment increased from 10.6 per cent of all employees in 2003 to 14.6 per cent in 2007.
[239]
The parties drew our attention to a range of indicators of relative living standards. These included measures of movements in wages other than award wages, including AWOTE, AWE and the WPI, comparisons between the minimum wage and median earnings, the overall distribution of earnings, the outcomes of enterprise bargaining and international comparisons based on OECD data. None of these directly determines the standard of living of the majority of individual wage earners who live in households with others. With that qualification, all of these are useful measures of the position of award-reliant employees in relation to employees generally.
[240]
Perhaps the most useful are the AWOTE, AWE and WPI data along with the data relating to enterprise bargaining. They indicate that over the past decade the FMW maintained its position relative to the WPI but lost relativity with other measures of earnings. At higher award classification levels, award rates have declined against each of those measures. The FMW and all other award wage rates have declined significantly in relative terms since the last general adjustment in 2008.
[241]
Over the last decade, GDP per hour worked rose by 16 per cent and in the market sector it rose by 20 per cent. This compares with the 2.4 per cent growth in the real value of the FMW and falls in the real value of award wages above the C10 rate over the same period. In the context of productivity growth and increasing community living standards, the maintenance of the real value of award wages alone would not adequately maintain relative living standards. This is one of a number of relevant considerations that we must take into account.
[242]
We agree that minimum wages and the tax/transfer system are both relevant to the maintenance of an effective safety net for the low paid: each has its part to play. Wages play a particularly important role in the maintenance of disposable incomes for households not receiving income support payments.
[243]
There was support among a number of parties for the view expressed by the Australian Social Inclusion Board that, for the low paid, the “… level of income needs to be of a standard to enable all workers to live in dignity”.
171
While the concept of living with dignity has a long provenance in Australian wage fixing, it is difficult to translate it into a specific monetary amount. We were presented with little evidence as to what this amount should be. We were not persuaded that updated measures of Budget Standards derived from the mid 1990s could provide us with useful guidance.
[244]
Our view is that the low paid need the highest level of wages that is consistent with all other objectives including low unemployment, low inflation and the viability of business enterprises. At the least, this level of wages should enable a full-time wage earner to attain a standard of living that exceeds contemporary indices of poverty. We are open to evidence that there are particular economic developments that are placing unusual and severe strain on the budgets of the low paid.
[245]
In relation to the relationship between minimum wage rises and employment levels, it should be noted that the likely impact of our decision on employment costs and employment growth are two of a range of considerations to which we are directed by the Fair Work Act, which must be balanced against other statutory considerations, such as relative living standards and the needs of the low paid. The requirement to consider the need to promote social inclusion (discussed in the next chapter) itself involves the competing considerations of the availability of employment, the quality of employment and the incentive to seek employment.
[246]
Our attention was drawn to extensive literature and studies concerning the relationship between minimum wage rises and employment levels, including modelling undertaken for the AFPC which found that minimum wage adjustments from 2005 to 2008 had only small effects on unemployment in the short-term, in the context of a strong labour market, although the employment effects become larger during a recession. The relevance of some of the studies is limited insofar as they are directed to the effects of increasing a single minimum wage in circumstances which are quite different to those which characterise the Australian industrial relations systems, including the range of minimum rates at various levels throughout the award system. Although a matter of continuing controversy, many academic studies found that increases in minimum wages have a negative relationship with employment, but there is no consensus about the strength of the relationship. Strong employment growth over the past decade in Australia, in the context of annual increases in minimum wages (other than in 2009) suggests that any impact of moderate minimum wage increases on employment levels is swamped by other factors affecting the demand for labour. We judge that in current economic circumstances, the increase in minimum wages we have decided on will not threaten employment growth.
6. Promoting Social Inclusion Through Increased Workforce Participation
[247]
As part of the minimum wages objective,
172
Fair Work Australia must establish and maintain a safety net of fair minimum wages, taking into account promoting social inclusion through increased workforce participation. Also, as part of the modern awards objective,
173
Fair Work Australia must ensure that modern awards, together with the NES, provide a fair and relevant minimum safety net of terms and conditions, taking into account the need to promote social inclusion through increased workforce participation.
Social inclusion and workforce participation
[248]
Most submissions accepted the proposition that raising employment levels is crucial to promoting social inclusion through workforce participation. However, views differed in relation to the relative emphases that should be put upon the “quantity” of employment and the “quality” of employment.
[249]
The Australian Social Inclusion Board submitted:
“The Board is of the firm view that the promotion of social inclusion relies on the promotion of decent work, and that decent work deserves decent wages. Building a socially inclusive Australia does not involve boosting employment at any cost. Allowing real minimum wages to erode over time will not promote social inclusion. We do not accept that social inclusion is enhanced in employment terms by adopting the position that there is a trade off to be made which involves increasing employment by driving minimum wages down.”
174
[250]
The Australian Government submitted that “promoting social inclusion through workforce participation” is about:
“… ensuring that there are adequate employment opportunities for people to engage in work, particularly those who are currently unemployed; increasing the incentive for employment where possible; and once employed, ensuring that low paid work provides a decent standard of living.”
175
[251]
The ACTU also argued that this part of the minimum wages objective goes beyond simply increasing the level of workforce participation. It submitted that “effective participation requires participation in quality employment, and in particular in jobs that pay decent wages”.
176
[252]
In contrast, Ai Group submitted that “[t]he objective of ‘promoting social inclusion through increased workforce participation’ … narrows considerations relating to social inclusion to those that are associated directly with increased workforce participation”.
177
ACCI also submitted that, in the context of this wage review, considerations around social inclusion should be centred on creating employment opportunities.
[253]
In its submission in reply, the ACTU argued that the reference to workforce participation requires us to “have regard to supply-side factors that encourage persons currently not in the labour force to seek employment”.
178
The Australian Social Inclusion Board also noted with concern the focus of some submissions on the demand for labour and submitted that its understanding of social inclusion includes “ensuring that individuals have adequate resources …”
179
During consultations Ai Group stated that the level of wages is relevant to social inclusion, but that in the current economic environment the more relevant consideration is ensuring that the demand for labour is not restricted by an excessive wage increase.
[254]
Parties had different views on how the term “increased workforce participation” should be interpreted. Ai Group submitted that workforce participation should be judged to have increased only if employment and/or hours worked have increased. The ACTU replied that this definition equates increased workforce participation with increased employment, and that the criteria would have been phrased in this way if it was intended that the Panel consider it as such.
[255]
A review of the literature on the relationship between social inclusion and participation in the workforce found that:
“Paid work is considered to promote social inclusion by increasing people’s resources (such as income, access to goods and services and human capital), developing their social networks and support, and improving their mental and/or physical health. On the other hand, some aspects of some work (e.g. underemployment, low pay, and long working hours, lack of access to training and career paths) may hamper a person’s opportunities to fully participate in society …”
180
“… it would seem that not all employed persons are socially included, and not all jobless or unemployed persons are excluded, but generally the risk of not being socially included is greater for the jobless than for people who are in paid work.”
181
[256]
It was generally accepted that participation in paid work has a positive effect on social inclusion. However, opinions varied on the implications of this relationship for minimum wage-setting, in particular due to the conflicting views on the relationship between minimum wages and employment.
Workforce participation
[257]
In April 2010 the labour force participation rate was 65.2 per cent and the employment to population ratio was 61.7 per cent (both in seasonally adjusted terms), with both series trending upwards over the past decade. The full-time employment to population ratio, especially for males, dropped significantly during the downturn and has not yet fully recovered.
[258]
Using the RBA’s analysis, the Australian Government submitted that, compared with previous downturns, the participation rate had not experienced the level of decline normally associated with the “discouraged worker” effect (that is, workers withdrawing from the labour market because of failed searches for employment). Part of the reason for this, it claimed, was likely to be the less severe nature of the current downturn. However, it also noted that many prospective retirees experienced a decline in the value of their assets, resulting in many of them staying in the labour market longer. Further, the participation rate of married women continued to trend upwards in the earlier stages of the downturn, which may have been a result of non-working spouses entering the labour force in an attempt to diversify household income (due to expectations of rising unemployment). ACCI cited the elevated rate of immigration as a driver of the continued growth in the labour force.
Unemployment and labour underutilisation
[259]
As shown in Chapter 3, in April 2010 the unemployment rate (in seasonally adjusted terms) was 5.4 per cent, which is a relatively low level of unemployment in comparison to outcomes over the past decade.
[260]
In the 2009–10 Budget, the unemployment rate was predicted to be 8¼ per cent in the June quarter 2010, while in the 2009–10 Mid Year Economic and Financial Outlook this prediction was revised to 6¾ per cent, still well above the 5.3 per cent recorded in March 2010. ABI submitted that, had average hours not fallen from 33.2 hours in June 2008 to 32.4 hours per week in February 2010, then the unemployment rate in February 2010 would have been above 7.5 per cent. In March 2010, the underemployment rate
(the proportion of the labour force that would prefer, and are available for, more hours of work) was 7.6 per cent, which was close to its highest level since the series began.
Citing the high level of underemployment, ACCI submitted that it is inappropriate to rely solely on the unemployment rate as a summary measure of labour market conditions.
[261]
ABI submitted that underemployment can be regarded as a positive flexibility in the labour market, in that it saves more people from the impacts of unemployment. However, it claimed that underemployment has (adverse) implications for a person’s future employment.
[262]
Ai Group submitted that the persistence of considerable levels of labour underutilisation in Australia was evidence of labour supply being greater than labour demand over an extended period. Therefore, they argued that:
“… in considering the impact of changes to minimum wages on workforce participation, the predominant emphasis should be given to the impact that changes to minimum wages may have on the demand for labour [as opposed to the impact on work incentives and the supply of labour].”
182
Participation and employment of selected groups
[263]
The parties identified a number of groups in the community who are particularly vulnerable and whose interests must be taken into account when considering the effect of minimum wage increases on social inclusion. These groups include low-skilled workers, young people and lone parents. For example, data from the ABS confirm that the employment situation of people aged 15–24 was more affected than older age groups during the downturn. Employment for people aged 15–24 decreased by 2.8 per cent from March 2008 to March 2010, with full-time employment decreasing by over 10 per cent. The unemployment rate increased by 3.2 percentage points over this period and the participation rate decreased by 2.3 percentage points. However, employment for people aged 15–24 has increased since mid to late 2009.
[264]
In relation to regional labour markets, the Australian Government submitted that while the labour market slowdown has affected most regions in Australia, some areas have been more adversely affected than others. It claimed that those regions with a higher proportion of their population employed in industries heavily affected by the downturn are likely to encounter greater difficulties, as are those areas that were already displaying entrenched labour market disadvantage.
[265]
ACOSS submitted that some countries with severe regional inequalities in the labour market have attempted to reduce unemployment in their most disadvantaged regions by allowing minimum rates of pay to vary between regions; however, it presented several reasons why Australia may not want to follow this practice. First, it submitted that, compared with other OECD countries, Australia has a low variation in regional unemployment rates. Secondly, it claimed that policies that directly address the main causes of high unemployment in disadvantaged areas are likely to be fairer and more effective than lowering minimum wages. Thirdly, it claimed that there is already a fair degree of flexibility in wages between regions in Australia, with lower-paid workers more likely to be located in rural and regional areas.
Labour market transitions
[266]
The Australian Government presented data from the HILDA Survey on the transitions between not being in paid work, “low paid” employment (defined in this case as two-thirds of median weekly earnings), and “higher-paid” employment. Its analysis, it submitted, illustrated that low paid work is an important entry point into paid work for persons who are not employed, and can also act as a “stepping stone” to higher paying jobs in the future. However, the analysis also illustrated that a proportion of low-paid workers remain in employment over time. The Australian Government submitted that “[t]hese individuals have a right to a fair wage that delivers a decent standard of living.”
183
[267]
The ACTU’s submission included a report by Dr Ian Watson of Macquarie University on mobility among the low paid workforce (defined in this case as those earning at or below the FMW). The report found that a proportion of low paid workers remain low paid for considerable periods of time. Also using the HILDA Survey, Watson found that, starting in 2001, of those adult employees who were earning at or below the FMW, 30 per cent (equivalent to around 187 000 employees) were still earning at or below the FMW a year later. (ACCI, in its reply submission, emphasised the “large” proportion of employees earning at or below the FMW that did move to higher-paid employment a year later, and claimed it as evidence that minimum wage jobs are a “pathway to higher earnings”.
184
) As of 2003, 24 per cent of employees who had been earning at or below the FMW in 2001 were still earning at or below the FMW, while by 2005 this figure had decreased to 20 per cent. Watson noted that after the initial drop the rate of exit into higher paying jobs was small.
185
[268]
Healy, drawing on evidence in relation to earnings mobility from previous wage reviews, claimed that women, older workers, workers with a low level of education, and workers in small firms have poorer prospects of moving to higher rates of pay.
Work incentives
[269]
The Australian Government submitted that higher minimum wages, all other things being equal, raise the financial incentives for those who are unemployed or not in the labour force to enter paid work.
186
For any given household, the strength of these incentives depend upon the interactions between wages, taxes and transfers, which in turn depend upon the composition of the household and the total income earned by its members.
[270]
The Australian Government also relied on the results of modelling by DEEWR on the incentives across a range of household types for people not in work to find a full-time job at $543.78 per week – the current minimum wage (and at $628 per week). According to their modelling, the disposable income of a jobless single adult would rise by 118 per cent from taking up a full-time job at $543.78 per week. Financial incentives for couples and lone parent households were more modest, however such households would also be financially significantly better off with one person working at the federal minimum wage than with no-one working. Furthermore, for couples, once one person had taken up a full-time job at $543.78 per week, households would still benefit financially from having a second person take up a full-time job at $543.78 per week, and in some of the cases the net improvement in financial position is greater than for the first job. (The results did not include any additional costs arising from employment such as child care or travel costs.)
[271]
ACOSS submitted that the gap between the income received when not employed and the income received from working in a low paid job could narrow to some extent without altogether removing the financial incentives to work. However, it noted that “if minimum wages fall consistently in real terms the gap will narrow over time, as income support payments are indexed to at least the CPI”.
187
[272]
ACOSS also submitted that only a minority of employees face high effective marginal tax rates.
188
In other words, after accounting for the effects of taxes and transfers, the majority of employees will retain a considerable portion of any given wage increase. However, it did note that the highest work disincentives are those affecting “people on Allowance payments working part time” and “second earners … in low and middle income families working part time”.
189
As shown elsewhere, award-reliant employees are more likely than other employees to be working on a part-time basis.
[273]
Ai Group submitted that market wages, rather than minimum wages, should be relied upon to provide incentives to enter paid work. It claimed that:
“If minimum wages are set too low to induce supply and so long as employers can at least cover their costs, employers will, without waiting to be prompted by a change in minimum wages, offer higher wages. This quintessential market adjustment will promote greater workforce participation and social inclusion without the need for an adjustment in minimum wage levels.”
190
[274]
In reply to this claim, the ACTU submitted that the Fair Work Act “does not devolve to employers the responsibility for the establishment and maintenance of [a] safety net of fair and relevant minimum wages”.
191
Conclusions
[275]
We accept the position advanced by the Australian Social Inclusion Board and others that social inclusion encompasses both the obtaining of employment and the pay and conditions attaching to the job concerned. It is clear in this context that for many minimum wage jobs are important entry points into paid work. On the other hand, on the available evidence, around 25 per cent of those in low paid jobs remain low paid for some years.
[276]
We agree with those who have submitted that we must be careful not to inhibit the growth of entry level jobs for vulnerable groups such as the young and low skilled workers. We accept that while incentives to work full-time are significant, where part-time work is concerned the position is less clear and the incentives may be less.
7. The Significance of Award Modernisation
[277]
Employer groups argued that cost increases resulting from the award modernisation process would affect employment growth, inflation and performance and competitiveness. For example, ACCI argued that:
“Award modernisation has imposed in many cases, non-productivity based additional labour costs, particularly for minimum wage reliant industries, which will threaten jobs, services and business viability.”
192
[278] There was a consensus amongst many employer submissions that the Panel should consider both the direct costs and compliance costs incurred by employers from the award modernisation process when setting the minimum wage.
[279]
R&CA argued that increased costs will be passed on to consumers through price increases on goods, which could hinder both business and consumer confidence:
“There is no doubt consumers will foot the bill through price increases on goods and groceries. Both the Australian Industrial Relations Commission’s new RIA [Restaurant Industry Award] and HIGA [Hospitality Industry General Award] will ensure increased costs with the consumer paying at a time when they can least afford it. Further inflationary pressures of this nature at a time of a shrinking labour market and crisis of confidence amongst employers and taxpayers is the last thing the restaurant and catering sector, the economy or the Australian government should be sanctioning.”
193
[280]
In its submission in reply, the Motor Trades Association of Australia also expressed concern about the additional costs imposed on employers during a time of “economic uncertainty and instability”, in which businesses have struggled to retain employment.
[281]
Some employer groups mentioned that the service industries, such as retail and hospitality, would be most affected by the changes to modern awards due to their high levels of award reliance. The AFEI warned that such industries had a “high level of sensitivity to labour cost increases.”
194
[282]
CCIWA submitted that some awards will experience a “significant up rating of conditions.”
195
This was also supported by the NRA, who commented that the most widespread cost increases will occur in Queensland (specifically south-east Queensland), as casual employees working in fast food, cafes and restaurants had not received evening and weekend penalty rates under the previous legislation.
[283]
In response, the ACTU argued that only a limited number of Queensland employers would face an increase in Sunday penalty rates. The ACTU also commented that the arguments and costings relied upon by employer submissions relate to either draft modern awards or modern awards that have since been varied and hence argued that the Panel should disregard this evidence as “irrelevant”.
196
[284]
Growcom remarked that the increase in farm labour costs resulting from the proposed modern Horticulture Industry Award 2010
197
would adversely affect business operations and warned that “[g]rowers who are unable to appropriately maintain plant and equipment, or generate a sufficient profit motive to continue operations will be forced to leave the industry.”
198
[285]
Business SA, the VACC, ARA, the NRA and R&CA commented that the award modernisation process will adversely affect small businesses and argued that these businesses could not afford a significant minimum wage increase, particularly in light of the recent economic downturn.
[286]
The NRA added that adverse outcomes are more likely to impact small firms because of the prevalence of collective bargaining in larger firms and as a result, larger firms are unlikely to be affected by the introduction of modern awards and decisions made by the Panel.
199
[287]
Business SA argued that costs will be increased for “[a] number of historically award-free industries and occupations”
200
that are now covered by awards.
[288]
Few submissions specifically addressed how the need to ensure a simple, easy to understand, stable and sustainable modern award system for Australia that avoids unnecessary overlap of modern awards should be considered in the course of an annual wage review. ACCI submitted that a “sustainable modern award system” referred to ensuring minimum wage increases did not affect employment:
“A sustainable Modern Award system is one that does not negatively impact jobs as a result of significant and unsustainable increases to the safety-net.”
201
[289]
The ACTU submitted that moderate increases made with a “medium and long-term view” would ensure no “drastic” revision of the system of minimum wages under the Fair Work Act:
“… minimum wage fixing should be set with a medium and longer-term view. Increases which are regular (i.e. more or less annual), moderate (broadly in line with inflation and national productivity growth), and predictable (i.e. annual increases announced with some period of notice prior to date of effect) fit the bill … large, infrequent, unexpected increases in minimum wages would upset business planning in an uncertain economic world. Big surprises are not what business needs; big surprises may cause hasty and drastic revision of business plans. The economic consequences of minimum wage decisions delivering hefty, unexpected increases with immediate effect would (arguably) be bad for inflation, productivity growth, employment growth, business competitiveness and viability…”
202
[290]
Other submissions from employer groups, including ANRA, CCIQ, HIA and MBA highlighted that there was confusion among employers regarding the operation and application of modern awards, particularly with relation to the transitional phasing arrangements included in most modern awards.
[291]
There was no evidence of the net cost of award modernisation and the material, even on an industry basis, was not comprehensive. Increases in wages and some conditions will be phased in in five instalments and this will moderate the effect of cost increases. We are also aware that the modern awards will bring significant benefits for many employers, including some reductions in minimum wages, penalty rates and other conditions. We accept that for some employers, particularly in award-reliant industries, there will be cost increases arising from the application of modern award wages and conditions. And this is clearly a relevant consideration for us.
8. Encouraging Collective Bargaining
[292]
The modern awards objective requires us to ensure that modern awards, together with the NES, provide a fair and relevant minimum safety net of terms and conditions, taking into account the need to encourage collective bargaining.
203
[293]
In its submission, the Australian Government discussed the potential impacts of minimum wage increases on the quantum of increases sought in collective agreement negotiations, however it did not specifically address the impact on “encouraging” bargaining:
“According to the Department of Education, Employment and Workplace Relations” (DEEWR) Workplace Agreements Database, around 23 per cent of current federal enterprise collective agreements (CAs) covering 20 per cent of employees employed under such agreements, link terms and conditions in some form to annual wage review outcomes. It is important to note, however, that only 13 per cent of federal CAs, covering six per cent of employees employed under such agreements, automatically ‘flow on’ annual wage review decisions. For the remainder, conditions and/or qualifications of some type apply.
Minimum wage increases can also act as a floor for workplace bargaining. A higher minimum wage increase may encourage higher wage claims and outcomes in workplace bargaining negotiations.”
204
[294]
The Ai Group noted the legislative requirements and submitted:
“It is
important
that the level of increase in minimum wages determined by FWA not reduce the scope for bargaining over wages at the workplace level. This would conflict with the objects of the Act.”
205
[295]
A number of submissions cautioned against an increase to minimum wages that would discourage collective bargaining. For example, Ai Group argued that the encouragement of enterprise agreement-making needs to be a foremost consideration and that, to encourage collective bargaining, minimum wage increases need to be significantly below the average enterprise agreements outcomes.
[296]
CCIWA, ACCI and ABI were concerned that the need for bargaining will be reduced if any increase in minimum wages is more than “moderate”.
206
ABI argued that:
“Anything larger than a moderate increase in award and minimum wages would diminish the wage differential between award reliant and non-award reliant employees, and would undermine the incentives that employees in these sectors have to seek to achieve enterprise agreements.”
207
[297]
In its submission in reply, the ACTU argued that the large gap between wage outcomes of award-reliant employees and employees covered by collective agreements preserves the incentives to bargain, which was supported by Healy, and that wage increases in collective bargaining outcomes bear little resemblance to minimum wage increases.
[298]
The Queensland Government also submitted that the current gap between the wage outcomes of minimum wage workers and those able to bargain provides a significant incentive for employees to seek to bargain for wage increases and commented that:
“The fact that some employees have remained award-reliant, despite the fact their rate of pay falls well short of the pay of those on agreements, suggests that employees are not choosing to remain subject to award only rates. The reality is that, for a variety of reasons, not all employees are able to bargain with their employers for wage increases.”
208
[299]
APESMA noted that:
“In the private sector there are relatively only a very small number of enterprise agreements that include coverage of professional employees. In most instances there is little or no capacity to collectively bargain. Often there is no history of collective representation of professional employees and in many workplaces the culture does not provide a climate for collective agreements that include this group.”
209
[300]
Healy highlighted the “impediments to bargaining” faced by a specific cohort of workers as an area for further research. Healy argued that a significant proportion of higher skilled and award-reliant employees were unable to move into the bargaining stream, for reasons unknown. While some of their wages were set above the thresholds typically used to define low pay, Healy argued that they remain “legitimate beneficiaries” of safety net increases and commented that any adjustments made to all minimum rates of pay would not “discourage” collective bargaining:
“Based on the available evidence about the gap between award and agreed wage outcomes … we rate as low the risk that the adjustment of all minimum pay rates will ‘discourage’ bargaining.”
210
[301]
In response to Healy, ACCI’s submission in reply argued that:
“The author does not appear to appreciate the statutory provisions in the Act that modern awards form the basis for enterprise agreement making, and rates of pay contained in modern awards must be met, regardless of whether an agreement is in force. Minimum wage adjustments do have a real impact on bargaining and the incentive to bargain …”
211
[302]
We accept that the gap between award minimum wages and bargained wages is likely to increase the incentive for employees to bargain. On the other hand, a large gap may be a disincentive for employers to bargain. Furthermore, minimum wages are only one element of the incentive to bargain, which may be more directly affected by other conditions, such as penalty rates, and economic factors including those specific to the enterprise concerned. Looked at more broadly, there is no evidence that the incentive to bargain has been adversely affected by the increases in minimum wages which have occurred over the last decade. There has been a very significant reduction in award reliance across all industries, including those which are traditionally regarded as award-reliant. The evidence, although not completely satisfactory, indicates that increases in minimum wages are compatible with the continuing encouragement of enterprise bargaining.
9. The Principle of Equal Remuneration for Work of Equal or Comparable Value
[303]
We are required to take the principle of equal remuneration for work of equal or comparable value into account.
212
Section 302(2) of the Fair Work Act defines equal remunerationas:
“Meaning of equal remuneration for work of equal or comparable value
(2) Equal remuneration for work of equal or comparable value means equal remuneration for men and women workers for work of equal or comparable value.”
[304]
There was a recognition amongst parties that the equal remuneration principle is defined more broadly than in previous legislation. The Australian Government submitted:
“… The expansion of the equal remuneration principle to include the term comparable value provides for the consideration of pay equity from a perspective broader than formal equality.”
213
[305]
The Queensland Government submitted:
“While the concept of ‘equal value’ allows for equal remuneration when men and women are doing identical work, ‘comparable value’ allows for a broader consideration of the factors that contribute to pay inequity. Such factors may include entrenched historical practices, the invisibility of women’s skills, the lack of powerful presence in the industrial system including a lack of access to enterprise bargaining, and how the way we value work is understood.”
214
[306]
The South Australian Government submitted:
“
In the more recent wage setting reviews at the federal level, the AFPC set minimum wages within a quite narrow economic focus. It was not legislatively obliged to consider wage justice and pay equity goals as part of its wage setting parameters. South Australia advocated strongly for the inclusion of the principle of equal remuneration for work of equal or comparable value to be included in the FW Act and more specifically in the minimum wage and modern awards objectives. The South Australian Government welcomes the fact that FWA has the opportunity and the obligation to consider gender pay equity issues in making its minimum wages decisions into the future.”
215
[307]
The ACTU submitted:
“… the need to strive to equal remuneration has been re-cast to require FWA to have regard to ensuring equal pay for comparable work- a wider test than have previously featured in our laws.”
216
[308]
The Queensland Government further submitted that we should formulate an Equal Remuneration Principle, similar to the one applied by the Queensland Industrial Relations Commission, to outline the types of factors which need to be addressed in assessing the value of work especially when determining matters of equal remuneration.
[309]
The Australian Government noted that the Fair Work Actdoes not specify how the principle of equal remuneration must be taken into account in the course of a minimum wage review and that pay equity considerations may best be addressed through other mechanisms under the Act such as individual pay equity or “work value” cases on an industry or occupational basis, enterprise bargaining or the low paid bargaining stream. The Government noted that the Australian Services Union has made an application to Fair Work Australia for an equal remuneration order for the social and community sector.
[310]
ACCI and CCIWA supported the view that pay equity matters are best addressed through parts of the Fair Work Actthat specifically address pay equity.
[311]
The Australian Government, supported by the ACTU, submitted that pay equity is affected by gender in that industries in which female employment predominates tend to attract much lower levels of pay than other industries and that many such industries also have high award or pay scale-reliance.
[312]
The South Australian Government submitted:
“Gender pay differentials exist across all professions and at all levels. While research suggests that pay inequity is generally less in low-paid industries as compared to the differences estimated for higher paying industries, it is important to note that much of the growth in women’s employment has been in the four ‘low pay’ award-reliant retail, accommodation, property and health services.”
217
[313]
The ACTU submitted:
“The Award system remains a central means for dealing with gender pay inequality and is both a robust minimum safety net and a decent foundation upon which workers are able to bargain …
Industries with high female employment typically demonstrate a high level of Award dependency, and consequently female workers depend disproportionately on minimum wage increases to improve their pay. As the majority of workers dependent on minimum wages are women workers, upward adjustment of minimum wages will have an impact on gender pay inequality.
Austen, Jefferson, Preston and Seymour found:
● Women’s overrepresentation in low paid jobs implies that the current gender pay gap would be greater if minimum wage adjustments had not been awarded between 1995 and 2005. Analysis shows that the minimum wage adjustments awarded between 1995 and 2005 contributed to a reduction in the gender pay gap by approximately 1.2 percentage points.
● Minimum wage decisions appear to be an important source of wage growth for many women.
● In the absence of minimum wage adjustments, it is likely that the gender pay gap would have been up to 2.7 per cent greater …”
218
[314]
The Queensland Government referred to ABS data that show that the gap between male and female full-time adult earnings rose from 15.3 per cent in the February quarter 2008 to 17.5 per cent in the November quarter 2009.
[315]
Research by Healy noted the effect that minimum wages, and the adjustment of minimum wages, have on women:
“… when the minimum wage falls in real terms, as a result of non-adjustment in periods of inflation, inequality increases in the bottom half of the wage distribution.
This process has a larger impact on inequality for groups of workers that rely more heavily on minimum wages to set their pay, including women.”
219
[316]
Although no submissions specifically argued that particular modern awards should be adjusted to account for pay equity issues, a number of parties, including the ACTU, the New South Wales and Western Australian Governments and WEL, argued that increases to modern award minimum wages would improve pay equity.
[317]
In its reply submissions, ACCER argued that any increases to minimum wages should be made as a percentage rather that as a “flat dollar” amount to prevent a “decline” in female pay rates:
“On this material it appears that a cause of the relative decline in female pay rates over recent years has been the awarding of dollar rather than percentage increases and, in 2006 and 2007, the awarding of lower wage increases to those earning over $700 per week. The adverse impact of past safety net decisions on the remuneration of women is another reason why percentage increases should be awarded in the current review.”
220
[318]
The Australian Government, however, submitted that
an excessive minimum wage
increase for the purpose of reducing the gender pay gap could prove
counterproductive in terms of its negative effects on overall employment.
It also pointed to the President’s power to refer matters for further investigation under s.290(1) of the Fair Work Act and encouraged us
to consider the use of this option should submissions in relation to minimum wage setting raise specific matters relating to pay equity and work value matters that require detailed consideration.
[319]
On the basis of the material we conclude that an increase in minimum wages is likely to assist in promoting pay equity given the relatively high proportion of women among the award-reliant, although it may not be the most effective means for achieving this end. Research directed to a more precise identification of the extent and composition of the award-reliant sector might be of assistance. We deal later with some issues concerning research generally.
10. The Decision
[320]
In this chapter we consider our decision in relation to modern award minimum wages and the national minimum wage for adult award/agreement free employees. Leaving aside increases in minimum wages which may have arisen as a result of award modernisation, there have been no increases for the relevant employees since October of 2008. We deal first with modern award minimum wages.
[321]
The modern awards objective and the minimum wages objective, which are set out in Chapter 1, prescribe the criteria to be applied in annual wage reviews. The modern awards objective requires Fair Work Australia to ensure that modern awards, together with the NES, provide a fair and relevant safety net of terms and conditions. In the context of an annual wage review, the Panel is therefore required to ensure that, so far as minimum wages are concerned, modern awards provide a fair and relevant safety net. The minimum wages objective is in different although complementary terms. It requires us to establish and maintain a safety net of fair minimum wages.
[322]
Each of these objectives directs us to take various matters into account. To a large extent this decision has been structured around a consideration of those matters. We do not repeat them all here. While we have taken all the matters into account, in this part of our decision we focus on the issues and circumstances which appear most relevant to this particular annual review. We start with the economic circumstances.
[323]
Economic growth, as measured by growth in real GDP, peaked at over 5 per cent in the year to the June quarter 2007 before slowing to around 1 per cent in late 2008. By the end of 2009 GDP growth was close to the trend rate of 3 per cent. Over 2009 growth in most OECD countries was negative and the Australian economy has performed better than other developed economies over the period of the GFC.
[324]
While productivity growth dipped during 2008 it recovered strongly in 2009. Over the past decade the profits share of national income has increased at the expense of the wages share. While this trend was interrupted over the last year or so, it appears now to have resumed. Growth in company profits faltered during 2008, but had resumed by the end of 2009.
[325]
Inflation was relatively stable for the first half of this decade with the CPI remaining mostly within the RBA target range of 2 to 3 per cent. Inflation peaked in the September quarter 2008. In the year to March 2010 the CPI increased by 2.9 per cent, the employee household ALCI by 1.9 per cent and, according to the RBA, underlying inflation was 3 per cent.
[326]
In relation to wages growth, AWOTE has grown at an average annual rate approaching 5 per cent over the last decade. Growth in the WPI was around 4 per cent in 2008 and 3 per cent for the year to March 2010.
[327]
Employment and aggregate hours worked have increased for most of the decade, despite an interruption during 2009. Employment grew by 2.1 per cent between 2009 and March 2010. The full-time employment to population ratio has continued to fall since its peak in 2007 and in March 2010 was at its lowest level in the past decade. The unemployment rate reached a low of 4 per cent in February 2008 after 7 years of decline. It then increased to 5.8 per cent in July 2009 but on the most recent data appears to be falling again.
[328]
The 2010–11 Budget forecasts attributed the relatively shallow downturn in the domestic economy to monetary and fiscal policy stimulus, noting that private sector activity is expected to drive growth in 2010–11. Growth in GDP in 2010 is expected to be 3 per cent and in 2011, 3½ per cent driven by household consumption, business investment and exports. Unemployment is expected to continue to fall. Employment is expected to grow by 2¼ per cent to June 2012. Wages are expected to grow strongly. Underlying inflation is expected to stabilise at around 2½ per cent. The RBA’s forecasts for inflation are slightly higher at around 3 per cent. Treasury and RBA forecasts identified downside and upside risks which we referred to earlier in our discussion of the economy.
[329]
We emphasise, as we noted earlier, that over the past decade there has been a relatively small growth in the real value of the NMW, about 2 per cent, which is well below the growth in labour productivity of 16 to 20 per cent. The implication is that minimum wage earners have only shared to a very limited extent in the benefits of productivity growth.
[330]
We turn now to a more detailed consideration of developments in the last two years. Several of the parties suggested that we should arrive at an increase in minimum wages based on developments since the last adjustment in minimum wages in the federal system. We consider that such an approach is useful. Several different starting points were suggested. We have decided that it is appropriate to consider changes in the key indicators that were available to the AFPC when it gave its wage-setting decision in July 2008.
Table 10.1: Wage and price inflation, selected periods
|
|
March 2008 to
March 2009
|
March 2009 to
March 2010
|
March 2008 to
March 2010
|
|
WPI
|
4.1
|
3.0
|
7.3
|
|
AWOTE
|
5.6
|
5.8
|
11.7
|
|
CPI
|
2.5
|
2.9
|
5.4
|
|
ALCI
|
2.4
|
1.9
|
4.4
|
[Source: ABS, Labour Price Index, Australia, Mar 2010, Catalogue No. 6345.0; ABS, Average Weekly Earnings, Australia, Feb 2010, Catalogue No. 6302.0; ABS, Analytical Living Cost Indexes for Selected Australian Household Types, Mar 2010, Catalogue No. 6463.0.]
[331]
Looking first at indications of wages growth, in the two years since March 2008 the WPI grew by 4.1 per cent and 3 per cent. Earnings as measured by AWOTE grew by 5.6 per cent and 5.8 per cent – 11.7 per cent in aggregate over the same period. While it would be unrealistic to base our decision on the growth in earnings as measured by AWOTE, because that series is affected by compositional change, the data are relevant in particular to an assessment of relative living standards. The WPI, a more accurate measure of wage growth, has also increased substantially – an aggregate of 7.3 per cent over the two years. On any view there has been strong growth in earnings during the period despite a significant slowing in growth in the WPI in the past 12 months.
[332]
Prices, as measured by the CPI, grew by 5.4 per cent between March 2008 and March this year. The employee household ALCI increased by 4.4 per cent over the same period. In light of the increases in these price measures it is clear that there has been a significant decline in the real value of minimum wages during this period. The decline in the real value of wages at the higher award levels has been relatively greater.
[333]
Our review of economic conditions indicates that since March 2008 the Australian economy has performed much better than expected. During that time, productivity, prices and real earnings have grown but minimum wages have not. There is a strong case for a rise in minimum wages to provide a fair and relevant safety net, protect the relative living standards of award-reliant employees and assist the low paid to meet their needs. The forecasts for 2010–11 give strong grounds to conclude that such an increase could be awarded without threatening business viability, employment growth or adding to inflation. We have concluded that a significant increase in minimum wages is warranted. We deal now with the form of the increase.
[334]
Many parties supported a uniform increase expressed in dollar terms, although there were some suggestions of a tiered dollar increase. The proposals ranged from $10 per week to $49 per week. Other proposals involved percentage increases.
[335]
In considering the nature of the increase we are particularly conscious of the requirement that we ensure modern awards provide a fair and relevant minimum safety net. The history of adjustment of minimum wages in federal awards since the legislated introduction of enterprise bargaining in 1993 has been one of dollar increases rather than percentage increases. This has compressed relativities in the award classification structures. While the compression of relativities is an important issue in itself, a number of parties also submitted that it is desirable that the real value of minimum wages should be maintained throughout award structures, not just at the lower levels or at the level of the minimum wage. The fall in the real value of minimum wages at various award levels is demonstrated by Chart 5.2 set out in Chapter 5. Furthermore, there may be adverse implications for the incentive for employers to bargain if the gap between award wages and earnings is too big.
[336]
We consider there is a strong case for a percentage adjustment to all modern award minimum wages. While not all award-reliant employees are low paid, uniform dollar increases reduce the relevance of the safety net at the higher award levels and erode the real value of award wages at most levels. These are particularly important considerations at the commencement of the modern awards system. Nevertheless most of the major parties supported a dollar increase rather than a percentage one.
[337]
With some hesitation we have decided on a dollar increase. There are two reasons. The first is that to the extent there is a choice between a percentage increase benefiting the higher levels and a dollar amount benefiting the lower levels we think that the current circumstances favour a greater benefit for the lowest paid. We are required in particular to take the needs of the low paid into account. In light of the fact that award-reliant employees have not had an increase in wages since 2008, it is desirable that we increase award rates by the largest amount consistent with the statutory criteria. Secondly, we have very little data concerning the impact of a percentage increase on costs and employment. We have insufficient information to be confident that a percentage increase would not have disproportionate effects on employment at the higher award levels. Nevertheless in the Annual Wage Review 2010-11 we expect to be addressed on the issues we have raised and to be provided with relevant data, including cost estimates. We return to next year’s review in a later chapter dealing with research.
[338]
We have decided on an increase of $26 in all modern award minimum weekly wages. There will be proportionate increases in hourly minimum wages and annual salaries.
[339]
The national minimum wage for adult award/agreement free employees is currently set at the minimum wage for the C14 classification, the lowest wage level in the Manufacturing and Associated Industries and Occupations Award 2010.
221
That position should continue. The national minimum wage in the national minimum wage order will be $569.90 per week or $15 per hour. The hourly rate has been calculated on the basis of a 38 hour week for a full-time employee, consistent with s.62 of the Fair Work Act. This constitutes an increase of $26 per week or 69 cents per hour on the transitional NMW.
[340]
We deal now with the question of operative date. Section 286 of the Fair Work Act provides that a determination varying modern awards in an annual wage review comes into operation on 1 July in the next financial year, but that a later operative date may be specified if we are satisfied that there are special circumstances justifying this. Section 287 contains similar provisions in relation to the operative date of a national minimum wage order. A number of parties to the review submitted that exceptional circumstances justify delay in the operative date this year.
[341]
Some parties sought a general delay in the operative date to apply across the board while others sought a delay related to a particular industry or modern award. ACCI, supported by the MBA and a number of other employer parties, submitted that the operative date should be one clear month after our decision.
[342]
Ai Group submitted that the operative date should be 1 January 2011 for employers in particular industries or parts of industries that are faced with large cost increases on 1 July 2010 as a result of award modernisation. For the same reasons, Ai Group sought a delay in the implementation of modern award minimum wage increases for employers in the fast food industry in Queensland and Western Australia previously covered by two particular Notional Agreements Preserving State Awards (NAPSAs). The Australian Hotels Association sought an operative date of 1 August 2010 for any increase to minimum wages in the Hospitality Industry (General) Award 2010.
222
ANRA sought an operative date of 1 October 2010 for any variations to the General Retail Industry Award 2010
223
because of complexity and cost increases from the modern award system.
224
[343]
The ACTU opposed all of the submissions seeking a delay on the basis of exceptional circumstances. In particular it argued that employers have benefited from a delay in the implementation of transitional arrangements in modern awards from 1 January 2010 to 1 July 2010 and should not be entitled to now argue for a further delay to avoid concurrent timing of transitional arrangements and minimum wages adjustments.
[344]
In its decision of 2 September 2009 the Award Modernisation Full Bench considered the commencement date of modern awards and the interaction with this annual wage review in the following passage:
“[29]
A number of employers proposed that the introduction of new wages and conditions should be delayed for a period to enable employers to make necessary arrangements. This approach has merit. There should be adequate lead time to prepare for the operation of the modern awards after their finalisation. In this regard we note that the Stage 4 awards are not scheduled for publication until the end of 2009. There is another important consideration. As we have indicated, the phasing arrangements will not apply to all changes in minimum conditions. We consider it desirable that before phasing commences there be an opportunity for employers and employees to come to terms with the other changes which might have a significant impact. Yet another consideration is that Fair Work Australia is required to conduct an annual review of minimum wages in modern awards and any increase resulting from such review is to operate from 1 July in the year in question. There is some advantage in synchronising the operation of the phasing provisions with increases in minimum wages.
[30]
We have decided that phasing should commence on 1 July 2010. The effect will be that where the phasing provisions are included in an award the pre-modern award conditions relating to minimum wages, casual and part-time loadings, Saturday, Sunday, public holiday, evening and other penalties and shift allowances will continue to apply until 1 July 2010 when the modern award obligations will commence. Despite the fact that the legislation contemplates the introduction of modern awards from 1 January 2010, a delay of six months in the implementation of the phasing arrangements is reasonable when the range and nature of the changes which will be required are properly taken into account. There will be a further four instalments on 1 July of each year concluding on 1 July 2014. Consistent with s.287 of the Fair Work Act, the changes in wages and conditions covered by the phasing arrangements will operate from the first pay period on or after 1 July in each year.”
225
[345]
We are not satisfied that exceptional circumstances exist justifying an operative date later than 1 July. It would not be appropriate to delay the operation of our decision in this review on account of award modernisation. It is apparent that increased costs resulting from award modernisation have already been taken into account by the AIRC in deciding upon the transitional provisions and operative dates in modern awards. Furthermore, the material advanced in support of a delay based on award modernisation was not convincing. We also think it would be undesirable to provide for different operative dates for some industries or groups of employers when it is clear that modern award conditions will impact differently across the economy generally depending upon the arrangements which previously applied. As to the general delay of one month sought by ACCI and others, in the circumstances, including the date of this decision and the fact that 1 July is the operative date which would generally apply, we do not think any further delay is justified.
[346]
The operative date of our determinations and the national minimum wage order will be 1 July 2010. We note that under ss.286(5) and 287(5) they will take effect from the first full pay period that starts on or after that date.
[347]
For completeness we mention two other matters. R&CA submitted that a different, lower increase should apply to employees in the accommodation, cafes and restaurants sector on the basis that the relevant employers do not have the capacity to pay higher increases because of the increase in costs from the introduction of modern awards, the uncertain economic outlook and the high proportion of small businesses in the hospitality industry. The NRA also sought a lower increase for employees covered by the Fast Food Industry Award 2010
226
and the General Retail Industry Award 2010. It submitted that any increase in minimum wages resulting from the review should be offset against the increased wage costs resulting from award modernisation. Neither of these parties advanced material which would justify different treatment of the kind it sought. In particular the material advanced by them relating to the costs of award modernisation was not persuasive.
11. Modern Award Minimum Wages for Junior Employees, Employees to Whom Training Arrangements Apply, Employees with Disability and Piece Rates
[348]
The minimum wages objective requires us to establish and maintain a safety net of fair minimum wages, taking into account “… providing a comprehensive range of fair minimum wages to juniors, employees to whom training arrangements apply and employees with a disability”.
227
Modern award minimum wages include wage rates for junior employees, employees to whom training arrangements apply, employees with disability, casual loadings and piece rates.
228
We deal with each of these types of minimum wages in this chapter. We deal with casual loadings in a later chapter.
Junior employees and employees to whom training arrangements apply
[349]
A junior employee is definedas “a national system employee who is under 21 years of age”.
229
“Training arrangements” are defined as“… a combination of work and training subject to a training arrangement, or training contract, that takes effect under State or Territory law”.
230
[350]
Most modern awards specify wages for juniors and/or employees to whom training arrangements apply as a percentage of the relevant adult minimum wage. Where no junior rates are specified junior employees are paid the applicable adult rate. Apprentice wages are generally expressed as a percentage of the tradesperson classification. There is a schedule dealing with the minimum wages of school-based apprentices in most modern awards. Most modern awards also include a schedule dealing with minimum wages for trainees.
[351]
In its decision of 19 December 2008 the Award Modernisation Full Bench made some relevant observations concerning wages for junior employees and apprentices:
“The federal awards and NAPSAs with which we are dealing contain a very wide range of rates for junior employees and apprentices. The relevant instruments fix percentages of the adult wage for juniors and apprentices based on a host of historical and industrial considerations, most of which can only be guessed at … We have attempted to strike a balance as between, in some cases, wildly varying provisions. In the case of junior employees the rates will be expressed as a percentage of the rate for the relevant adult classification. In the case of apprentices the rates will generally be expressed as a percentage of the relevant trade rate.”
231
[352]
We also note that minimum wages for juniors and employees to whom training arrangements apply, like adult minimum wages, are subject to the transitional arrangements in modern awards.
[353]
Most parties submitted that there is no need to make specific provision for juniors and employees to whom training arrangements apply because their wages are fixed as a percentage of the relevant adult rate. In its reply submission ACCI contended that we should take the effect of minimum wage increases on youth employment and underemployment into account. While this consideration is a relevant one when considering increases in minimum wages generally, and we have commented on it earlier, we do not understand ACCI to be suggesting that we should adopt a different approach to the adjustment of wages for these employees in this review. While ACOSS and WACOSS expressed some concerns about the potential effect of junior rates on the employment of minimum wage workers, they did not advance any specific proposals for this review. Some organisations, for example ACOSS, suggested that an increase in the relativity of rates for employees to whom training arrangements apply and the relevant parent rates could address the low uptake and completions of apprenticeships and traineeships. Again, no specific proposals were advanced.
[354]
R&CA requested we consider making alternative policy recommendations to address the affordability of apprenticeships and traineeships without increasing the relativity of training wages to parent rates.
[355]
We have decided that junior employees and employees to whom training arrangements apply should receive the benefit of the increase in minimum wages generally. Because of the manner in which those wages are derived, no special action is necessary. If any of the relevant minimum wages are expressed in dollar terms, a proportionate adjustment should be made.
[356]
A number of parties, in particular the Australian Government, submitted that Fair Work Australia should conduct a review of minimum wages for apprentices and trainees. We deal with these proposals in Chapter 14 in discussing the requirement to establish special national minimum wages for juniors and employees to whom training arrangements apply.
Employees with disability
[357]
Section 12 of the Fair Work Act defines an employee with disability as:
“… a national system employee who is qualified for a disability support pension as set out in section 94 or 95 of the Social Security Act 1991, or who would be so qualified but for paragraph 94(1)(e) or 95(1)(c) of that Act.”
[358]
Under the Social Security Act 1991
a person qualifies for the Disability Support Pension (DSP) where the person is 16 and is permanently blind (s.95) or satisfies the criteria of section 94(1) of the Social Security Act 1991, which provides that the person qualifies for the DSP if:
“(a) the person has a physical, intellectual or psychiatric impairment; and
(b) the person’s impairment is of 20 points or more under the Impairment Tables; and
(c) one of the following applies:
(i) the person has a continuing inability to work;
(ii) the Health Secretary has informed the Secretary that the person is participating in the supported wage system administered by the Health Department, stating the period for which the person is to participate in the system; and
(d) the person has turned 16 …”
[359]
Section 94 of the Social Security Act 1991
provides that a person will meet the requirement of a “continuing inability to work” where they are unable to work independently of a program of support (or undertake training to enable such work) for at least 15 hours per week at a relevant minimum wage for a fully productive employee.
Employment arrangements for employees with disability
[360]
There are two types of employment for employees with disability covered by modern award minimum wages:
● open employment; and
● supported employment through Australian Disability Enterprises (formerly known as “business services” or “sheltered workshops”).
[361]
Open employment refers to the general workforce where employees with disability, as defined by the legislation, compete with fully productive employees in a commercial setting. As such, employees with disability are covered by the same minimum wage industrial instruments that apply to other employees in their workplace.
[362]
Employees with disability in open employment fall into two categories:
● employees who are able to earn full adult, training or junior modern award wages (with reasonable adjustment as appropriate)
232
as their disability does not impair their productive capacity; and
● employees who are unable to perform the range of duties to the competence level required within the class of work for which the employee is engaged because of the impact of their disability on their productive capacity.
[363]
The Employees with disability: open employment and the Supported Wage System (SWS) report details wage setting for employees with disability in open employment.
233
The SWS is the productivity assessment system used to assess employees with affected disability in open employment to ascertain the relevant minimum wage.
234
The report reviews the history of wage setting arrangements for employees with disability with and without affected productivity in open employment as well as the development of the SWS in open employment. The SWS is included in a schedule in most modern awards.
235
[364]
Australian Disability Enterprises are businesses that provide employment to people with disability who generally require support to remain in employment. Employees in Australian Disability Enterprises are generally covered by one minimum wage instrument the Supported Employment Services Award 2010.
236
[365]
In relation to employees in open employment there was general support for reduced minimum wages for employees with disability and for the use of the SWS as the sole method for assessing productivity, although ACOSS expressed concern that the minimum wages for these employees are too low. There was general support for permitting the increases in minimum wages generally to apply to employees with disability through the operation of the SWS. ACOSS suggested that the wage outcomes for employees with disability in Australian Disability Enterprises should be monitored with a view to standardising the assessment tools to a greater degree in the future.
[366]
Employees with disability in open employment should have the benefit of the increase in modern award minimum wages on a proportionate basis. This will occur through the existing modern award mechanisms. Most submissions did not separately address variation of the Supported Employment Services Award 2010. Minimum rates of pay in this award will be adjusted in accordance with our decision.
[367]
A number of parties, including the ACTU, ACCI and ABI proposed that we adjust the SWS minimum weekly payment (presently $71) to equal the weekly equivalent of the maximum per fortnight income test free earnings for pensions. This would be consistent with past practice. The same submissions were made in relation to the special National Minimum Wage 2, applying to award/agreement free employees.
[368]
We shall increase the SWS minimum weekly payment outlined in the SWS model clause in modern awards (and in special National Minimum Wage 2) in a separate determination after the weekly income test free threshold for a single person receiving the DSP is announced by the Australian Government, expected to be on 1 July. We think the circumstances are exceptional.
Piece rates in modern awards
[369]
The majority of submissions to the review did not address the issue of piece rates in modern awards or pieceworkers generally. The increase in modern award minimum wages we have decided on will flow through to pieceworker rates through the various formulas in modern awards. Given the form of the increase on this occasion no other action is required.
12. Transitional Australian Pay and Classification Scales, Division 2B State Awards and Other Transitional Instruments
[370]
As indicated in Chapter 1, we are required by the Transitional Act to review a number of types of transitional instruments. They are transitional APCSs, Division 2B State awards and State reference transitional awards. If we decide to vary any of these instruments, there is no requirement to publish the variations.
237
Some parties made submissions on a general basis about these awards. It is more convenient, however, to deal with each type of instrument separately.
Transitional APCSs
[371]
Transitional APCSs are instruments derived from APCSs which existed at 30 June 2009. APCSs were notionally created on 26 March 2006 from the pay and classification scales in minimum wage instruments such as pre-reform federal and state awards and also include other industrial tribunal decisions and instruments (including minimum wage orders for Victoria).
238
They continue to exist until terminated by Fair Work Australia.
[372]
Most parties urged us to vary transitional APCSs in order to maintain the wages of employees covered by them. ACCI, however, submitted that most employees are now covered by modern awards and, except in the case of enterprise instruments, there is no need to vary them. The ACTU submitted in response that there still may be employees covered by transitional APCSs who are not covered by a modern award and that until the process of setting transitional APCSs aside has been completed it would be prudent to keep them up-to-date.
[373]
We note that employees covered by enterprise award-based instruments continue to be covered by transitional APCSs after the commencement of modern awards. We consider that we should maintain the safety net for those employees and for any employees who may not be covered by a modern award and therefore remain covered by a transitional APCS. We shall vary all weekly wage rates in transitional APCSs by the amount of $26 with proportionate hourly increases. While we shall not vary the casual loading percentages or piece rate relativities in transitional APCSs, the increase will usually be passed on to casual and piecework employees since most are paid a percentage of the relevant wage rate. Wage rates for juniors and employees to whom training arrangements apply, where not expressed as a percentage of an adult rate, should be increased proportionately.
Division 2B State awards
[374]
Division 2B State awards are instruments derived from State awards in New South Wales, Tasmania, South Australia and Queensland at 1 January 2010. They cover State reference employees and employers not in the federal system prior to 1 January 2010 who were previously covered by state awards, including state enterprise awards. Division 2B State awards, other than Division 2B enterprise awards, terminate on 31 December 2010.
239
[375]
Division 2B enterprise awards are subject to the enterprise instrument modernisation process in Schedule 6 to the Transitional Act. It is appropriate to vary wage rates in Division 2B enterprise awards and we do so. The other Division 2B State awards require separate consideration.
[376]
A number of parties made submissions regarding the variation of Division 2B State awards and took different approaches. The Queensland Government’s submission included the following passage:
“Impact of Referral of State Private Sector Industrial Relations Powers
7. The Queensland Government submits that the referral of its state private sector industrial relations powers should not adversely affect the wage outcomes of Queensland workers entering the national industrial relations system for the first time in 2010. Of particular concern are:
…
9. The Queensland Government does not agree with submissions (Including submissions by Australian Chamber of Commerce and Industry; Australian Federation of Employers and Industries; Australian Business Industrial and Master Builders Australia.) that Division 2B State award workers should be excluded from an increase because of:
● the higher pay rates in Division 2B State awards:
● the temporary nature of Division 2B State Awards; or
● the legislative requirement for FWA to consider varying modern awards to continue effect of the terms of the Division 2B State awards.
10. These arguments would have the affect of imposing a wage freeze on workers moving into the national industrial relations system.”
240
[377]
The South Australian Government submitted:
“
The South Australian Government submits that it is appropriate for FWA to consider strategies to maintain the real value of minimum wages for those employees who are covered by Division 2B State awards within the broader context of their ultimate transition to modern award coverage on 1 January 2011.”
241
[378]
The ACTU submitted:
“We acknowledge that minimum wage employees covered by Division 2B awards have not suffered the same reduction in real wages that applied to employees who were in the federal system during the period 2006-2009. Nonetheless the decisions of State Tribunals that resulted higher minimum wages in the state jurisdictions were made on criteria not dissimilar to that which now governs the federal system. The Division 2B award rates are minimum safety net rates, and employees covered by those awards are no less entitled to trust that the Tribunal will have regard to their needs as low paid employees, and their relative living standards, and award them an increase equal to that awarded to employees covered by other instruments.”
242
[379]
ACCER submitted:
“Without an increase in the Division 2 State awards, employees covered by those awards would have a wage freeze imposed on them. Having regard to the fact that these State rates are not identical and that they were set by State tribunals on different dates, ACCER submits that the most appropriate means of adjusting those rates is by the application of the published CPI changes since the date of the last State tribunal adjustment. This will maintain the real value of those rates and provide a better basis for the full transition of these employees into the national system. We do not agree with the claim by ACCI (at paragraphs 89-90) that they should not be adjusted.”
243
[380]
A number of employer parties, however, argued that we should not increase wages in Division 2B State awards. These parties included ACCI, Business SA, CCIWA, ABI, the AFEI, MBA and the NSW Dental Association. They gave various reasons.
[381]
ACCI, AFEI and CCIWA argued that rates in the Division 2B State awards are generally higher than modern award rates, that these instruments will soon terminate and that it is not appropriate to increase the rates pending Fair Work Australia’s investigation of whether special transitional provisions are needed.
[382]
CCIWA submitted that there should be no increase in the Division 2B State awards because:
“… the new entrants into the Federal system are unincorporated – generally smaller firms that are likely to be cost sensitive and already having to comply with FW Act safety net requirements – and should have a staged transition before being required to fully comply with the FW Act.”
244
[383]
The AFEI submitted:
“[T]hat no determination should be made by FWA to vary wages in Division 2B State awards. 2B award employers have already been recipients of 2009 minimum wage increases in their jurisdictions, or are to receive such increases within 2010. In the NSW jurisdiction these increases were awarded subject to the application of the Wage Fixing Principles 2003-2009 determined by the Industrial Commission of NSW. Relevantly, Principle 8 states that at least 12 months must have elapsed since the rates in the award were increased in accordance with the State Wage Case 2008 decision.
As the Australian Fair Pay Commission did not alter the national minimum wage in 2009, there is already a significant differential between state minimum rates, the national minimum wage and also between state award minimum rates and comparable minimum rates in other federal instruments and modern awards. If state award employers are required to pay further increases as a consequence of a FWA minimum wage increase in 2010, this disparity will be compounded and they will be subject to cost increases resulting from both State industrial bodies and FWA.”
245
[384]
Business SA submitted that there should be no adjustment because:
“… employees moving into the Federal jurisdiction as a result of South Australia’s referral of industrial relations power, may get two (2) increases in nine (9) months, the increases awarded by the State Commission on 1 October 2009 and an increase, if awarded by Fair Work Australia, effective from 1 July 2010.”
246
[385]
ABI argued that while Division 2B State awards should not generally be adjusted, the Division 2B State award derived from the New South Wales Social and Community Services Employees (State) Award
(SACS award) should be varied along with wages in modern awards to bring it into line with the higher rates in the transitional APCS derived from the SACS award at 26 March 2006. This disparity had apparently occurred as a result of the AFPC awarding minimum wage increases in addition to preserved work value increases (unlike its Division 2B equivalent) from 2006–2008.
[386]
The Australian Dental Association NSW made a request for deferral of any wage increase that might otherwise apply in the Division 2B State award derived from the Dental Assistants and Secretaries (State) Award. The Association made this submission on two grounds:
● that there would be a New South Wales State Wage Case decision due to take effect on 21 July 2010 that it argued would continue to apply to the Division 2B State award; and
● that this would compound the already existing disparity between wages currently paid by unincorporated employers in New South Wales.
[387]
Item 3 of Schedule 3A of the Transitional Actstates that a Division 2B State award is taken to have the same terms as the “source” award as “affected by an order, decision or determination of a State industrial body or a court of the source State that was in operation immediately before the Division 2B referral commencement [1 January 2010]” with some specified exceptions.
247
That means that the instrument was preserved, with any increases afforded, at that point in time. Item 3 of Schedule 3A to the Transitional Actcreates the Division 2B State awards from “source” state awards as affected by orders, decisions and declarations in operation at 1 January 2010. The NSW State Wage Case 2009
248
increase may not to be captured in the Division 2B State New South Wales Dental Assistants and Secretaries State Award
as it was not operational at 1 January 2010.
[388]
We have decided not to vary minimum wages, casual loadings or piece rates in Division 2B State awards as part of this review, other than wages in Division 2B enterprise awards. Division 2B State awards, other than enterprise ones, are the subject of a separate exercise by Fair Work Australia to review whether transitional arrangements in modern awards should be varied because of the termination of Division 2B State awards on 31 December 2010.
249
That exercise will provide an opportunity to properly consider all of the issues that may be relevant to the termination of a particular award. Any increase afforded now would have the potential to unreasonably complicate the position. It is relevant that employees covered by Division 2B State awards have generally had the benefit of an increase in minimum wages in calendar year 2009. Our approach is also consistent with the transitional provisions in modern awards which provide for absorption of differences in pre-modern award and modern award wages into the amount awarded in this review.
250
State reference transitional awards
[389]
State reference transitional awards are award-based transitional instruments that existed under the WR Actand are preserved by the Transitional Act. Instruments in this class cover Victorian employees who were affected by the 1996 Victorian referral of powers as well as employers (and their employees) who were unincorporated at 26 March 2006 and covered by federal awards. The Transitional Act specifies a number of different instruments as “state reference transitional awards”. They are:
● Division 2A State reference transitional awards;
● Division 2A State reference transitional enterprise awards;
● Division 2A State reference public sector transitional awards;
● Division 2B State reference transitional awards;
● Division 2B State reference transitional enterprise awards; and
● Division 2B State reference public sector awards.
[390]
F
ew submissions raised specific arguments regarding the adjustment of state reference transitional awards. As with other transitional instruments, the New South Wales
Government
, Queensland Government, ABI and ACTU supported these instruments being increased.
[391]
We have decided to vary all state reference transitional awards in line with the increase afforded to modern award minimum wage rates. Consistent with our approach in relation to other transitional instruments, we shall not vary casual loading percentages or piece rate relativities in these instruments. Wage rates for junior employees and employees to whom training arrangements, where not expressed as a percentage of an adult rate, should be increased proportionately.
Continuing Schedule 6 instruments
[392]
Continuing Schedule 6 instruments include transitional awards and common rules not affected by state references.
251
Schedule 6 transitional awards appear to only apply to unincorporated employers (and their employees) in Western Australia which were bound by a federal award prior to 26 March 2006. Common rule awards under Schedule 6 were confined to Victoria. Because of the Victorian referral of powers no employers or employees are covered by such common rules.
[393]
The ACTU submitted that Schedule 6 transitional awards may be varied to reflect the outcome of the review. In the consultations it stated its position as follows:
“Both ACCI and ABI question whether Schedule 6 transitional awards fall within an annual wage review. Transitional awards continue to bind employers in Western Australia.
Item 1 of Schedule 20 continues 6 (sic) of the Workplace Relations Act and the power to vary transitional awards. Schedule 6 applies as if a reference in that Schedule to the AIRC or the AFPC were a reference to FWA and a reference to wage setting decisions of the AFPC were a reference to determinations made by FWA in annual wage reviews.”
252
[394]
The ACTU also noted that item 2(1)(g) of Schedule 20 continued the application of Schedule 6 only “from the time when FWA completes its first annual wage review” indicating it is not for the Panel to exercise any of these powers but for Fair Work Australia. We think this construction is correct and agree that we do not have power under the Fair Work Act or the
Transitional Act to vary these instruments.
It is, however, open to parties to apply to Fair Work Australia to have these instruments varied to reflect increases decided on in the annual wage review.
253
Review of transitional instruments
[395]
ACCI noted in their submission that there was some difficulty for employers with the transitional arrangements and proposed that either Fair Work Australia or the Australian Government clarify the status of instruments subject to the annual wage review.
[396]
Arrangements will be made for the Minimum Wages and Research Branch of Fair Work Australia to provide information about the full range of transitional instruments. A draft will be released for comment before finalisation of the material.
13. Casual Loadings under Modern Awards and Casual Loadings for Award/Agreement Free Employees
[397]
We are required to review casual loadings in modern awards and to set a casual loading for award/agreement free employees.
254
This loading must be expressed as a percentage.
255
[398]
We deal first with the casual loading in modern awards. The Full Bench of the AIRC, as part of award modernisation, adopted a standard casual loading of 25 per cent in December 2008.
256
We do not consider it appropriate to review casual loadings in modern awards again in light of the recent AIRC review. The standard casual loading in modern awards will be maintained at 25 per cent, subject where relevant to the operation of the transitional provisions in the awards.
[399]
We deal now with the question of a casual loading for award/agreement free employees. On 1 January 2010, Fair Work Australia is deemed to have created a transitional national minimum wage order which set a casual loading for award/agreement free employees at 20 per cent.
257
This loading was derived from the default casual loading in the WR Act.
258
Though empowered to do so until March 2008, the AFPC did not make any determinations to adjust the rate from that specified in the AFPCS.
259
[400]
The ACTU, in its submission in reply, argued that the casual loading for award/agreement free employees should be raised to 25 per cent consistent with the level of the casual loading in modern awards. Ai Group, ACCI, ABI, Business SA and CCIWA, all opposed any increase.
260
[401]
Ai Group and ABI both argued that if we decide to increase the casual loading for award/agreement free employees to parity with modern awards, the increase should be to no more than 21 per cent, in order to reflect the phasing arrangements contained in modern awards. For example, Ai Group submitted:
“If Ai Group’s primary submission is not accepted, and FWA is of the view that a 25% loading should be implemented, Ai Group proposes that the casual loading be increased to 21% this year, with a further 1% increase implemented in each subsequent year (if the prevailing circumstances warrant it) until 25% is reached.”
261
[402]
R&CA however sought a reduction in the casual loading for award/agreement free employees on the basis that:
“In the terms of the National Employment Standards the leave for which the casual rate is compensating is annual leave, personal/carers leave and compassionate leave. Taken at their maximum this leave accounts for just on 13% of the hours worked in a year. Restaurant & Catering Australia asks the Fair Work Australia to consider revising the casual loading down to this figure and to make clear the basis on which the casual loading is set, noting the non discretionary nature of the loading.”
262
[403]
In our view the casual loading for award/agreement free employees should be brought into line with the standard casual loading in modern awards. It would not be appropriate to increase the loading to 25 per cent in this review. We propose to adopt the suggestion that the loading be increased in instalments consistent with the transitional arrangements in modern awards. We shall set the casual loading for award/agreement free employees at 21 per cent.
14. Setting Special National Minimum Wages for Award/Agreement Free Junior Employees and Employees to Whom Training Arrangements Apply
[404]
Sections 294(1)(b)(i) and (ii) of the Fair Work Actrequire that a national minimum wage order must include special NMWs for award/agreement free junior employees and employees to whom training arrangements apply. Under the terms of the Transitional Act we may defer the setting of special NMWs for juniors and employees to whom training arrangements apply until the Annual Wage Review 2010–11.
263
[405]
In a statement issued on 19 February 2010
264
we expressed a preliminary view that we would defer the setting of special NMWs for junior employees and employees to whom training arrangements apply until the 2010–11 review and invited submissions from those supporting a different course.
265
Most parties agreed with this proposal. The South Australian Government, however, expressed concern over the absence of special national minimum wages for junior employees as did some other parties.
[406]
We have decided to defer setting special national minimum wages for junior employees and employees to whom training arrangements apply until the Annual Wage Review 2010–11.
[407]
In light of our decision to defer, the President must establish a process to set the relevant rates in the Annual Wage Review 2010–11.
266
As indicated earlier, the President will convene a conference to consider the process to be established
[408]
The Australian Government requested that we include a structure for any review of apprentice and trainee wages in this decision:
“The Government would like to reiterate its support that a broad review of apprentice and trainees award wages and conditions take place as soon as possible in order to build on and complement the broader VET reform agenda.
A review of this nature would align with a proposed review of the Australian Apprenticeships system with a view to future reform.
…
The Government asks the Panel to indicate in its decision to the 2010 Annual Wage Review whether it or FWA intends to conduct [a review of wages for employees to whom training arrangements apply] and if so provide interested parties with an indication of the timeframe …”
267
[409]
During the consultations the Australian Government detailed the announcement in the 2010–11 Federal Budget that a broad review of vocational training by an expert panel would be undertaken. The Australian Government then submitted that any review by the Panel into apprentice wages should be timed around the review of the proposed “expert panel”:
“The work of the expert panel will be underpinned by a study on related economic costs and benefits, to be conducted by the National Centre for Vocational Education Research, and will report to the government by the end of 2010. The work of the expert panel will provide important material and guidance which will intersect with any review undertaken by Fair Work Australia on the workplace relations framework for apprentices.
If Fair Work Australia conducts the proposed review of apprentice and training, wages and conditions, it would be most beneficial if it were to coincide - or at least overlap - with this important body of work. The Commonwealth will seek to make submissions on the work of the expert panel to Fair Work Australia as part of any broader review.”
268
[410]
A number of other parties supported the proposal for a review.
[411]
In its decision of 2 September 2009 the Award Modernisation Full Bench indicated a preliminary view that a review of apprentice wages could be undertaken in the context of an annual wage review:
“We agree, however, that it would be desirable to develop a unified national system of training and employment conditions for apprentices. We note in this respect that Fair Work Australia is required to set national minimum wages for award/agreement free employees to whom training arrangements apply in either its first or second annual wage review … It is highly likely that this process will require a review of wages and conditions for apprentices nationally.”
269
[412]
Any review to inform the setting of the special NMWs for junior employees and employees to whom training arrangements apply will need to be undertaken to allow sufficient time to inform submissions and consultations as required by the Fair Work Actfor the Annual Wage Review 2010–11.
[413]
We anticipate that a review will commence in the second half of 2010. Following the release of this decision the President will announce a conference to consider the form the review will take and to develop a timetable.
15. Setting Special National Minimum Wages for Award/Agreement Free Employees with Disability
[414]
The minimum wages objective requires us to establish and maintain a safety net of fair minimum wages, taking into account “providing a comprehensive range of fair minimum wages to … employees with a disability” (s.284(1)(e)). In particular we are required to include in the national minimum wage order a special NMW for award/agreement free employees with disability.
270
[415]
The AFPC previously set two special federal minimum wages for two different classes of employee with disability.
271
On 1 January 2010 Fair Work Australia was deemed to have created a transitional national minimum wage order with two special national minimum wages from the two special federal minimum wages created by the AFPC.
272
The first special NMW applies to award/agreement free employees with disability whose productivity is unaffected by their disability. The wage is set at the adult NMW. The second special NMW applies to award/agreement free employees with affected productivity and allows an employee to have an assessment under the SWS applied against the NMW rate.
[416]
Neither instrument applies to junior employees and employees to whom training arrangements apply.
[417]
Nor do these instruments apply to award/agreement free employees with disability in the national system who are Division 2B State reference employees. Such employees must be paid a minimum wage that is at least equal to the special national minimum wage.
273
[418]
While the extent of coverage of the two special national wages is unclear,
274
there was broad agreement that the two transitional instruments should continue.
[419]
The Ai Group submitted:
“… the Full Bench [as it] noted in its Statement of 19 February 2010, the Fair Pay Commission in 2006 set special minimum wages for two classes of employees with a disability. Ai Group has not detected any difficulties with the structures established by the Fair Pay Commission for employees with a disability and supports their continuation through the inclusion of appropriate provisions in the national minimum wage order in 2010.”
275
[420]
ACCI submitted that:
“With respect to providing support for workers with a disability, ACCI continues to strongly support special wage arrangements applying for those in both open employment and Disability Enterprises (formerly known as sheltered workshops, business services or supported employment). Appropriate minimum wage arrangements for persons with a disability are supported by employers, and should be considered within the broad mix of policy initiatives.”
276
[421]
The ACTU supported the creation of two instruments noting the exclusions applying to certain types of employees such as contractors and short-term employees:
“The ACTU believes that award free employees with disability who are contractors, employees in short-term or temporary jobs, or employees engaged in work where core duties and tasks change frequently, whether or not their productive capacity is affected by their disability should be covered by the National Minimum Wage Order which will succeed transitional special national minimum wage 1.
To give effect to this, the scope of new special National Minimum Wage Order that replaces transitional NMW Order Number 2 should be reduced to exclude these employees, ensuring that their safety net is set by the general special NMW order.”
277
[422]
There is insufficient information to assess the implications of the ACTU proposal. It is appropriate that the two special national minimum wages be part of the national minimum wage order resulting from this review.
16. Conclusion
[423]
In this chapter we summarise the outcome of the review and mention some matters relevant to the future.
[424]
The outcome of the review in relation to modern award minimum wages is that from the first full pay period on or after 1 July 2010 minimum wages are increased by $26 per week and 69 cents per hour (on the basis of a 38 hour week). The increase applies to minimum wages for junior employees, employees to whom training arrangements apply and employees with disability and to piece rates through the operation of the methods applying to the calculation of those wages. The determinations necessary to give effect to the increase in modern awards will be made available in draft form shortly after this decision is announced. Determinations varying the modern awards will be made as soon as practicable and the modern awards including the varied wage rates will be published as required by s.292 of the Fair Work Act.
[425]
In relation to transitional instruments, from the first full pay period on or after 1 July 2010 wages in those instruments, including Division 2B enterprise awards, but not including other Division 2B State awards, are increased by $26 per week or 69 cents per hour based on a 38 hour week.
[426]
The national minimum wage order will contain:
(i) a national minimum wage of $569.90 per week or $15 per hour;
(ii) two special national minimum wages for award/agreement free employees with disability: for employees with disability whose productivity is not affected a minimum wage of $569.90 per week or $15 per hour based on a 38 hour week, and for employees with disability whose productivity is affected, an assessment under the SWS; and
(iii) a casual loading for award/agreement free employees of 21 per cent.
[427]
Before concluding there are two related matters that require mention. The first concerns research, the second concerns the process and timetable for the Annual Wage Review 2010–11.
[428]
A number of parties made suggestions for research to be conducted or commissioned by Fair Work Australia. The suggestions included, for example, research into the needs of the low paid and the effect of adjustments in minimum wages on small business. For our part, we consider that research into the composition of the award-reliant workforce and the relationship between minimum wages and the incentive to bargain would be useful.
[429]
We intend to give consideration to a research program as soon as practicable. We invite interested parties to lodge proposals for research by 31 July 2010. The President will convene a public conference with the Panel to discuss the proposals. Thereafter we shall decide on a research program. The program will not necessarily be limited to the proposals put forward.
[430]
In relation to the 2010–11 review generally, and in light of the foreshadowed conference on wages for employees to whom junior and training arrangements apply, we shall review the process and timetable over the coming months and announce a program in October 2010.
[431]
We extend our gratitude to the parties who participated in this year’s review for their contributions and to the staff of Fair Work Australia for their assistance in the conduct of the review.
PRESIDENT
1
Fair Work Act, s.286.
2
ibid., s.287.
3
ibid., s.292.
4
ibid., s.289.
5
ibid., s.291.
6
ibid., s.284(3).
7
Transitional Act, item 2 of Sch. 9.
8
ibid., item 12 of Sch. .9.
9
ibid., item 4 of Sch.. 9.
10
ibid., items 10 and 20 of Sch. 9 and item 12A(6) of Sch.3.
11
ibid., items 10 (1) and 20 (1) of Sch. 9 and item 12A(5) of Sch.3.
12
WR Act, s.23.
13
Transitional Act, items 10(2) and 20(2) of Sch.9 and item 12A(6) of Sch.3.
14
ibid., item 21, of Sch.3A.
15
Modernisable instruments are award-based transitional instruments and transitional APCS that are part of the award modernisation process (see Transitional Act item 3(1), Sch.5.
16
Transitional Act, item 16 of Sch. 9.
17
Fair Work Act, s.286.
18
ibid., s.287.
19
Australian Government submission at p. 6, para 1.10.
20
ibid., at p. 17, para 2.2.
21
ACTU submission at p. 34, para 4.6.
22
Ai Group submission at p. 22, para 67.
23
Australian Government submission at p.25, para 2.52.
24
ACCI submission at p. 136, para 449.
25
Queensland Government submission at p. 16, para 54.
26
ACTU submission at p. 11, para 1.13.
27
ACCI submission at p. 84, para 318.
28
ibid., at p. 86, para 323.
29
Victorian Government submission at p. 15, para 2.8.3.
30
ACTU submission at p. 11, para 1.13.
31
ACTU submission at p. 11, para 1.13.
32
Australian Government submission at p. 56, para. 4.61; Victorian Government submission at p. 1.
33
ACCI submission in reply at p. 28, para 73.
34
ibid., at p.13, para 42.
35
Victorian Government submission at p. 10, para 2.2.3.
36
ACCI submission in reply at p. 1, para 6.
37
ACTU submission at p. 83, para 8.3.
38
ACCI submission in reply at p. 31, para 81.
39
Australian Government submission at p. 21, para 2.27.
40
Victorian Government submission at p. 12, para 2.5.4.
41
ACCI submission at p. 133, para 443.
42
Australian Government submission at p. 22, para 2.32.
43
Australian Government submission at p. 27, para 3.2.
44
ACTU submission in reply at p. 42, para 6.7.
45
ACTU submission at p. 51, para 5.16.
46
Australian Government submission at p. 28, para 3.8.
47
ibid., at p. 32, para 3.23.
48
ACCI submission at p. 112, para 395.
49
ACTU submission at p. 57, para 5.25.
50
ACCI submission in reply at p. 12, para 38.
51
Australian Government submission at pp. 18-19, para 2.10.
52
ibid., at p. 19, para 2.12.
53
Australian Government post-Budget submission at p. 3, para 6.
54
ACTU post-Budget submission at p. 4, para 1.4.
55
ibid., at p. 19, para 3.46.
56
Victorian Government submission at p. 11, paras 2.4.1.
57
ACCI submission at p. 77, para 303.
58
ACCI post-Budget submission at pp. 2–4, paras 8–12.
59
ACCI submission at p. 90, para 336.
60
ibid., at p. 129, para 435.
61
Australian Government submission at p. 23, para 2.36.
62
Victorian Government submission at p. 11, para 2.4.3.
63
Australian Government, Budget Paper No. 1: Budget Strategy and Outlook 2010–11, Canberra, 2010, p. 4.
64
National Farmers’ Federation submission at p. 4, para 10.
65
Australian Government submission at p. 28, para 3.10.
66
ibid., at p. 28, para 3.11.
67
ACCI submission at p. 93, para 348.
68
ACTU submission at p. 81, para 7.23.
69
The market sector refers to all industries except for public administration and safety, education and training and health care and social assistance. It also does not include ownership of dwellings.
70
Underlying inflation is the average of the trimmed mean and weighted median inflation measures. The RBA’s “trimmed mean” measure trims away the 15 per cent of items with both the smallest and largest price changes. The “weighted median” measures the price change at the 50
th
percentile by weight of the distribution of price changes.
71
Australia Government, Budget Paper No. 1: Budget Strategy and Outlook 2010–11, Canberra, 2010, p. 2-3.
72
ibid., at p. 2-3.
73
Queensland Government submission at p. 5, para 12.
74
Victorian Government submission at p. 28, para 4.1.0.
75
ACTU submission at p. 118, para 10.10.
76
WiSER submission at pp. 16–7; S Austen, Culture and the Labour Market, Edward Elgar, Cheltenham, UK, 2003, pp. 14–7.
77
ACCER submission at p. 18, para 43.
78
Australian Government submission at pp. 5–6, para 1.6.
79
ACCI submission at pp. 37–8, para 197.
80
ACTU submission in reply at p. 10, para 2.8.
81
South Australian Government submission in reply at p. 15.
82
ACTU submission at p. 17, para 2.15.
83
ABI submission in reply at p. 5.
84
ibid.
85
Transcript at para 98, 17 May 2010.
86
Transcript at paras 778–80, 18 May 2010.
87
Transcript at paras 676 and 679, 18 May 2010.
88
Australian Government submission at p. 79, para 5.50. As shown below, for the purposes of comparing growth in earnings across different parts of the earnings distribution, the Australian Government also referred in its submission to those in the bottom 10 per cent of the earnings distribution as low paid.
89
ACTU submission at p. 127, para 10.33.
90
ACCER submission at p. 100, para. 293.
91
Western Australian Government submission at p. 5, para 4.2.
92
ibid. at p. 6, para 4.4.
93
ABS, Employee Earnings and Hours, Australia, Aug 2008, Catalogue No. 6306.0, Canberra, 2009.
94
Earnings of employees who are reliant on minimum rates of pay, Fair Work Australia Research Report 4/2010, February 2010, at p. 4.
95
ACTU submission at p. 133, para 10.48.
96
Ai Group submission at p. 38, para 122.
97
Ai Group submission in reply at p. 7, para 18.
98
ACOSS submission at pp. 5–6.
99
ibid., at p. 6.
100
ACTU submission at p. 117, para. 10.5; ABS, Measuring Wellbeing: Frameworks for Australian Social Statistics, cat. no 4160.0, ABS, Canberra, 2001.
101
ABI submission at p. 45.
102
ACCER submission at p. 36, para 102.
103
For example: ACOSS submission at p. 3; South Australian Government submission in reply at p. 16; Victorian Government submission at p. 39, para. 4.5.0; Western Australian Government submission at p. 5, para. 4.1.
104
Australian Government submission at p. 84, para 5.63.
105
Ai Group submission in reply at pp. 5–7, paras 13–15; Australian Bureau of Statistics, Household Income and Income Distribution, 2007–08, ABS, Canberra, 2009 at p. 6.
106
New South Wales Government submission at p. 40, para 150.
107
ACOSS submission at p. 13.
108
Australian Government submission at pp. 71, 73, paras 5.32–5.33.
109
ibid., at pp. 75–6, paras 5.41 and 5.43.
110
ACTU submission in reply at p. 33, para 5.12.
111
Australian Government submission at p. 21, para 2.25.
112
ABI submission at p. 45.
113
ACCER submission at pp. 37–8, para. 107; ABS, Labour Price Index, December 2009, cat. no. 6345.0, ABS, Canberra, 2010, p. 16.
114
ACCI submission at p. 129, para 437.
115
ABI submission at p. 46.
116
ACTU submission at p. 124, para 10.22, Table 10.4.
117
ACCI submission at p. 134, para 446.
118
J Healy, “The Wages Safety Net of the Australian Industrial Relations Commission, 1993–2005”, PhD Thesis, 2009, National Institute of Labour Studies at pp. 138–143: Additional materials to the Annual Wage Review 2009–10, Fair Work Australia, 2010.
119
ACOSS submission at pp. 10–11.
120
ABI submission at p. 46.
121
ACTU submission in reply at p. 27, para 4.9.
122
Australian Government submission at p. 66, para 5.10.
123
Australian Government submission at p. 66, para 5.7.
124
ACCI submission at p. 27, paras 136–138; Ai Group submission at p. 65, para 216.
125
ACOSS submission at p. 6.
126
ACCER submission at p. 27, para 80.
127
WACOSS submission at p. 7.
128
Australian Government submission at p. 68, para 5.19; ABS, Analytical Living Cost Indexes for Selected Australian Household Types, December 2009, cat no. 6463.0, ABS, Canberra, 2010.
129
Australian Government submission at p. 66, para 5.11.
130
New South Wales Government submission at p. 3, para 14.
131
ACCI submission at p. 37, paras 192–93.
132
Ai Group submission at p. 30, para 100.
133
Australian Government submission at p. 89, para 5.85.
134
ACCI submission at p. 137, para 452.
135
ACCER submission at p. 52, para 154.
136
ABI submission at p. 47; ACCI submission at pp. 38–9, paras 4.14–4.16; Ai Group submission at p. 32, paras 114–115; CCIWA submission at pp. 25–6; Hotel Motel & Accommodation Association submission at p. 9; Australian Hotels Association submission at p. 6, para 4.13; Business SA submission at p. 20, paras 6.3.7.2–6.3.7.7; R&CA at pp. 21–2; VACC submission at pp. 7–8.
137
ACTU submission at p. 32, para 5.7.
138
Ai Group submission at p. 32, para 108.
139
ACTU submission at p. 163, para 11.90.
140
Australian Government submission at p. 76, para 5.46.
141
ACOSS submission at p. 1.
142
Australian Government submission at p. 84, para 5.62.
143
Western Australia Government submission at p. 6, paras 4.4–4.6.
144
ACOSS submission at p. 22.
145
ABI submission at pp. 43–4.
146
ACTU submission at p. 136, para. 11.3.
147
ACCER submission at p. 101, para. 297.
148
ACCER submission at p. 23, para. 67.
149
ACOSS submission at pp. 3–4.
150
ACCER submission at p. 83, para. 243.
151
ACTU submission at p. 24, para. 2.31.
152
This description of the Henderson poverty lines is drawn largely from the following articles: I Manning “The Henderson poverty line in review”, Social Security Journal, June, 1982 at pp. 1–13; and D Johnson “The calculation and use of poverty lines in Australia”, The Australian Economic Review, Issue 80, 4
th
Quarter, 1987 at pp. 45–55.
153
Commonwealth Department of Family and Community Services, Inquiry into Poverty and Financial Hardship, Occasional paper No. 9,
Submission to the Senate Community Affairs References Committee, June 2003.
154
P Saunders “Updated Budget Standards Estimates for Australian Working Families in September 2003”, SPRC Report 1/04, Social Policy Research Centre, University of New South Wales, 2004, Executive Summary.
155
ACTU submissions at pp. 153–4, paras 11.54–11.55.
156
ACTU submissions at pp. 153–4, para 11.58.
157
ACCER submission at p. 90, para 266.
158
ACOSS submission at p. 16.
159
ACCER submission at p. 104, para 305.
160
ACTU submissions at p. 133, para 10.52.
161
ACCI submission at p. 36; AFPC, 2009 Wage–Setting Decision and Reason for Decision, July 2009, at p. 64.
162
Australian Government submission at p. 56, para. 4.61.
163
ACTU submission at p.11, para. 1.13.
164
ACCI submission at p. 34, para 178.
165
ACCI submission in reply at p. 34, para 90.
166
Ai Group submission at p.39, para 127.
167
Ai Group submission at p.31, para 105.
168
New South Wales Government submission at pp. 26–7, para. 100.
169
ACCI submission in reply at p. 34, para 92.
170
An overview of compositional change in the Australian labour market and award reliance, Fair Work Australia Research Report 1/2010, 2010 at pp. 51–2.
171
Australian Social Inclusion Board submission in reply at p. 2.
172
Fair Work Act s.284(1)(b).
173
ibid., s.134(1)(c).
174
Australian Social Inclusion Board submission at p. 2.
175
Australian Government submission at p. 43, para 4.5.
176
ACTU submission at p. 94, para 9.16.
177
Ai Group submission at p. 41, para 138.
178
ACTU submission in reply at p. 15, para 3.4.
179
Australian Social Inclusion Board submission in reply at p. 1.
180
Literature review on social inclusion and its relationship to minimum wages and workforce participation, Fair Work Australia Research Report 2/2010, 2010, at p. 4.
181
ibid., at p. 36.
182
Ai Group submission at p. 46, para. 154.
183
Australian Government submission at pp. 5–6, para. 1.6.
184
ACCI submission in reply at p. 37, para. 100.
185
I Watson, Mobility Among the Low Paid Workforce, Australia, 2001 to 2008, Report for the ACTU, 26 February 2010, Attachment to ACTU submission at pp. 44–5.
186
Australian Government submission at p. 49, para 4.34.
187
ACOSS submission at pp. 39–40.
188
ibid., at p. 42.
189
ibid., at p. 41.
190
Ai Group submission at p. 48, para 166.
191
ACTU submission in reply at p. 23, para 3.38.
192
ACCI submission at p. 141, para 464.
193
R&CA submission at p. 23.
194
AFEI submission at p. 40, para 104.
195
CCIWA submission at p. 16.
196
ACTU submission in reply at p. 60, para 9.13.
197
MA000028
.
198
Growcom submission in reply at p. 5.
199
NRA submission at p. 4, para 10.
200
Business SA submission at p. 9, paras 4.2.10.5–10.7.
201
ACCI submission at p. 47, para 225.
202
ACTU submission at p.10, para 1.12.
203
Fair Work Act, s.134(1)(b).
204
Australian Government submission at pp. 10–11, paras 1.30–1.33.
205
Ai Group submission at p. 53, para 183.
206
ACCI submission at p. 54, para. 249; ABI submission at p. 38; CCIWA submission at p. 9.
207
ABI submission at p. 38.
208
Queensland Government submission at p. 22, para 76.
209
Transcript at para 200, 17 May 2010.
210
J Healy, “The Wages Safety Net of the Australian Industrial Relations Commission, 1993–2005”, PhD Thesis, August 2009, National Institute of Labour Studies at p. 282: Additional Materials to the Annual Wage Review 2009–10, Fair Work Australia 2010.
211
ACCI submission in reply at p. 40, para 108.
212
Fair Work Act,s. 284(1)(d), s.134(1)(e) and s.184(1)(d).
213
Australian Government submission at pp. 91–2.
214
Queensland Government submission at p. 11, paras. 39–40.
215
Government of South Australia submission in reply at p.19.
216
ACTU submission at p. 24, para 2.32.
217
South Australian Government submission in reply at p. 19.
218
ACTU submission, at p. 168–9, paras 12.3–5.
219
J Healy, op. cit. at p. 49.
220
ACCER submission in reply at pp. 5–6, paras 18–9.
221
MA000010
.
222
MA000009
.
223
MA000004
.
224
ANRA submission at p. 11.
225
[2009] AIRCFB 800
.
226
MA000003.
227
Fair Work Act, s.284(1)(e).
228
ibid., s.284(3).
229
ibid.,s.12.
230
ibid., s.12
231
[2008] AIRCFB 1000
at para 71.
232
Where “adult” rate of pay means a base periodic rate of pay that does not expressly apply to a class of employees to whom a training arrangement applies or junior employees.
233
Employees with Disability: open employment and the Supported Wage System (SWS), Fair Work Australia Research Report 5/2010, February 2010.
234
The SWS is also used in Australian Disability Enterprises as one of 30 approved wage assessment tools available for use.
235
The AIRC decided that some modern awards would not include SWS provisions based on safety considerations and the nature of the work the award covered –
[2009] AIRCFB 345
at para 30.
236
MA000103
.
237
Transitional Act, items 10(2), 20(2) and 12A(6).
238
The AIRC could make minimum-wage orders for employees within work classifications established in the Victorian industrial system before the initial referral of Victorian industrial relations powers to the Commonwealth in 1996 (see sections 501–501A WR Act, repealed by Workplace Relations (Work Choices) Amendment Act 2005). Those orders became APCSs from 26 March 2006. Unincorporated employers, and their employees, became covered by an APCS with specific rules in Division 2, Part 21 WR Act. Incorporated employers, and their employees, became covered by an APCS derived directly from the pre-reform order and subject to the same rules as other APCSs in Division 2, Part 7 WR Act (also see Workplace Relations Regulations 2006, ch 2, reg 7.2(1)).
239
Transitional Act, items 21(1) and (3) of Sch. 3A.
240
Queensland Government submission in reply at p. 3–4, paras 3–7 and pp. 4–5, paras 8–14.
241
South Australian Government submission in reply at pp. 4–6.
242
ACTU submission in reply at p. 13, para 2.24
243
ACCER submission in reply at p. 4, para 11.
244
CCIWA submissions at p. 34–5.
245
AFEI submission at p. 3, paras 4–5.
246
Business SA, submission at p. 10, para. 4.3.5.
247
Specified exceptions include items 55 and 60 of Sch. 3A and items 16 and 19 of Sch. 9 to the Transitional Act.
248
State Wage Case 2009, [2009] NSWIRComm 120.
249
[2010] FWA 3102
.
250
See modern award “Schedule A–Transitional Provisions” clause A.3.6.
251
Transitional Act, Sch. 20.
252
ACTU amendment to reply submission at paras 2.18–19.
253
Item 2, Sch. 20 to the Transitional Act gives Fair Work Australia the power of the AIRC to vary and revoke transitional awards by continuing the application of Sch. 6 of the WR Act. Clause 29 of the “continuing schedule 6” allows Fair Work Australia to vary a transitional award to settle or prevent an industrial dispute. Item 2, Sch. 3 to the Transitional Act amends the objects of continuing Sch. 6 to require any variation to wages and other monetary entitlements to be consistent with a decision of the annual wage review. There is no provision allowing the Panel to make the variation.
254
Fair Work Act,ss.284(3)(b) and 294(1)(c).
255
ibid.,s.295(1)(b).
256
[2008] AIRCFB 1000
at paras 47–50.
257
Transitional Act, item 12 of Sch. 9.
258
WR Act,s.186.
259
See AFPC, Wage-Setting Decision and Reasons for Decision, October 2006, AFPC, Melbourne at p. 126 and AFPC, Wage-Setting Decisions and Reasons for Decision, July 2007, AFPC, Melbourne at p. 97. From 28 March 2008, the AFPC was no longer empowered to adjust the default casual loading percentage due to amendments introduced by the Workplace Relations Amendment (Transition to Forward with Fairness) Act 2008 to the WR Act.
260
Ai Group submission at p. 69, para 226; ACCI submission at p. 23, para 114; ABI submission at p. 7; Business SA at p. 5, para 2.6; CCIWA submission at p. 56.
261
Ai Group submission at p. 70, para 232.
262
R&CA submission at p. 27.
263
Transitional Act,item 4 of Sch. 9.
264
[2010] FWAFB 1224
.
265
ibid., at para 5.
266
Transitional Act, item 4(3) of Sch. 9.
267
Australian Government submission at p. 106, paras 7.16–17 and 7.19.
268
Transcript at paras 277–78, 17 March 2010.
269
[2009] AIRCFB 800
at para 51.
270
Fair Work Act, s. 294(1)(b)(iii).
271
AFPC, Wage-Setting Decision and Reasons for Decision, October 2006, AFPC, Melbourne.
272
Transitional Act, item 12 of Schedule 9.
273
ibid., item 16 of Schedule 9.
274
Employees with disability: open employment and the Supported Wage System (SWS),
Fair Work Australia Research Report 5/2010, February 2010.
275
Ai Group submission at pp. 66–7, para 220.
276
ACCI submission at p. 45, para 219.
277
ACTU submission at p. 184, paras 15.13–14.
Printed by authority of the Commonwealth Government Printer
<Price code J, PR062010>