Figure 1: Average job tenure in years EU–15 for 192 and 2005
Lucy Nelms and Dr Constantine Tsingas
Minimum Wages and Research Branch—Fair Work Australia
February 2010
The contents of this paper are the responsibility of the authors and the research has been conducted without the involvement of members of the Minimum Wage Panel of Fair Work Australia.
ISBN 978-0-9807678-0-3
© Commonwealth of Australia 2010
This work is copyright. Apart from any use as permitted under the Copyright Act 1968, no part may be reproduced by any process without prior written permission from the Commonwealth. Requests and inquiries concerning reproduction and rights should be addressed to the Commonwealth Copyright Administration, Attorney General’s Department, Robert Garran Offices, National Circuit, Barton ACT 2600 or posted at http://www.ag.gov.au/cca
All research undertaken by or commissioned by Fair Work Australia for the Annual Wage Review 2009–10 has been agreed by the Research Group. The Research Group comprises a Chair from the Minimum Wage and Research Branch of Fair Work Australia, and representatives nominated by:
This paper, “Literature review on social inclusion and its relationship to minimum wages and workforce participation”, is the work of Lucy Nelms and Constantine Tsingas of the Minimum Wages and Research Branch, Fair Work Australia.
Lucy Nelms and Constantine Tsingas are grateful for comments provided by Professor Peter Whiteford, Social Policy Research Centre, University of New South Wales; Professor Kostas Mavromaras, National Institute of Labour Studies, Flinders University; and Dr Jane Romeyn & Dr Matthew Thomas. The authors would also like to acknowledge Troy Wheatley and Jocelyn Pech for their assistance.
A draft of this paper was workshopped with the Research Group prior to finalisation. Lucy Nelms and Constantine Tsingas would also like to thank the Research Group for its comments.
The contents of this research paper, however, remain the responsibility of the authors, Lucy Nelms and Constantine Tsingas.
Contents
2 Definitions of social exclusion/inclusion 11
3 Dimensions of social exclusion 14
4 Workforce participation and social inclusion 16
4.1 Paid work as a facilitator of inclusion 16
4.2 Aspects of paid work that may inhibit social inclusion 22
5 Indicators of social inclusion/social exclusion 29
5.1 Labour force participation 29
5.2 Employment rate, and employment of older workers 31
5.3 Long-term unemployment rate 31
5.4 Persons living in jobless households 31
5.5 People with a mild or moderate disability who are working 32
5.6 Geographic disparity in employment rates 32
5.8 Proportion of young people not in employment, education or training 33
6 Minimum wages and social inclusion/exclusion 34
Appendix 2—The federal government’s social inclusion approach 59
Appendix 3—Dimensions of social exclusion 61
Appendix 5—Selected studies of social exclusion: dimensions and indicators 64
Appendix 7—Indicators of labour market inclusion/exclusion 71
ABS |
Australian Bureau of Statistics |
ACIRRT |
Australian Centre for Industrial Relations Research and Training |
ACTU |
Australian Council of Trade Unions |
AFPC |
Australian Fair Pay Commission |
ALP |
Australian Labor Party |
ASIB |
Australian Social Inclusion Board |
AWALI |
Australian Work Life Index |
CASE |
Centre for the Analysis of Social Exclusion |
CUPSE |
Community Understandings of Poverty and Social Exclusion (survey) |
DPC Tas |
Department of Premier and Cabinet, Tasmanian Government |
DPC Vic |
Department of Premier and Cabinet, Victorian Government |
EC |
European Commission |
EU |
European Union |
FWA |
Fair Work Australia |
FW Act |
Fair Work Act 2009 |
HILDA |
Household Income and Labour Dynamics in Australia |
Melbourne Institute |
Melbourne Institute of Applied Economic and Social Research |
NATSEM |
National Centre for Social and Economic Modelling |
NEET |
not in employment, education or training |
NILS |
National Institute of Labour Studies |
OECD |
Organisation for Economic Co-operation and Development |
PSE |
Poverty and Social Exclusion (survey) |
SEU |
Social Exclusion Unit |
SIU |
Social Inclusion Unit |
Under the Fair Work Act 2009, the minimum wages objective requires Fair Work Australia to establish and maintain a safety net of fair minimum wages, taking into account, amongst other factors, promoting ‘social inclusion through increased workforce participation’. This is also a requirement of the modern awards objective. This paper reviews the concept of social inclusion and, in particular, the relationship between social inclusion and workforce participation.
There is no universal or generally accepted definition of either social inclusion or exclusion. Based on how the term has been used, social inclusion could be broadly understood as the process or means by which individuals and groups are provided with the resources, rights, goods and services, capabilities and opportunities to engage in cultural, economic, political and social aspects of life. The concept is still relatively new to Australia, although its significance to research, policy and legislation is growing.
A number of dimensions of social exclusion, beyond exclusion from the labour market, have been identified. Individuals can be affected by multiple and overlapping dimensions of exclusion and some researchers argue that social inclusion should not be confined to a context of paid employment. In this paper, workforce participation has been discussed, as one aspect of social inclusion, in relation to its impacts on other dimensions of social inclusion. Paid work is considered to promote social inclusion by increasing people’s resources (such as income, access to goods and services and human capital), developing their social networks and support, and improving their mental and/or physical health. On the other hand, some aspects of some work (e.g. underemployment, low pay, and long working hours, lack of access to training and career paths) may hamper a person’s opportunities to fully participate in society, as they may provide a worker with an inadequate income, interfere with their capacity to build and maintain human capital and social connections, or affect their health.
A range of indicators could be used to assess the extent and progress of social inclusion/exclusion. In relation to the labour market, possible indicators outlined in this paper include labour force participation (including the participation of particular groups), the long-term unemployment rate, people living in jobless households, and income adequacy. Since the concept of social inclusion is relatively new to Australia, key indicators are expected to be further refined.
Researchers have not explicitly focused on the links between minimum wages and social inclusion/exclusion, although there have been numerous studies with respect to the relationship between minimum wages and various dimensions of social inclusion/exclusion, including participation in the labour market and income. Minimum wages would be expected to raise the income from working, and therefore the financial incentives for people to take up employment or increase their hours. Minimum wages are also designed to restrict the degree of wage inequality and exploitation by reducing the power imbalance between employers and vulnerable groups in the workforce. However, there is mixed evidence as to whether these benefits are mitigated through a fall in labour demand. Minimum wages could also be seen to promote social inclusion through providing a safety net for workers.
Fair Work Australia (FWA)—more specifically the Minimum Wage Panel—is required by the Fair Work Act 2009 (FW Act) to set and vary minimum wages. Under the FW Act, the minimum wages objective requires FWA to establish and maintain a safety net of fair minimum wages, taking into account, amongst other factors, ‘promoting social inclusion through increased workforce participation’ (FW Act s.284). section 134 of the FW Act (modern awards objective) also requires that FWA ensures modern awards provide a fair and relevant safety net taking into account ‘the need to promote social inclusion through increased workforce participation’.
‘Social inclusion’ is mentioned in the Object of the Act, which ‘is to provide a balanced framework for cooperative and productive workplace relations that promote national economic prosperity and social inclusion for all Australians …’ (FW Act s.3). ‘Social inclusion’ is not defined in the Act.
This paper reviews the concept of social inclusion, and in particular examines the relationship between social inclusion and workforce participation as specified in the legislation.
The first section of this paper provides an outline of the origins and development of the concept of social inclusion. While this paper has been framed in terms of ‘social inclusion’, the discussion that follows necessarily encompasses ‘social exclusion’. The relationship of these two concepts is briefly explored in section 2, which discusses some of the definitions that have emerged and what these encapsulate. section 3 identifies various dimensions of social exclusion. Drawing upon these dimensions, section 4 discusses how participation in the workforce may facilitate social inclusion, but also looks at employment-related factors that may inhibit inclusion. section 5 presents various indicators of social inclusion/exclusion, focusing in particular on indicators relating to the labour market. The final section focuses on the relationship between minimum wages and various dimensions of social inclusion/exclusion, including participation in the labour market and income.
1.1 Background on the emergence and use of the concepts of social inclusion and social exclusion
Social exclusion1 has become one of the most important frameworks for conceptualising ‘the interrelations between economy and society under conditions of social change’ (Daly & Silver 2008:538). It has a range of theoretical origins (Daly & Silver 2008; Hills et al. 2002 in Hayes, Gray & Edwards 2008; Scutella, Wilkins & Horn 2009). The term social exclusion first emerged in the 1970s in France in reference to groups of people not covered by the social insurance system (Silver 1994), that is, ‘administratively excluded by the state’ (Burchardt, Le Grand & Piachaud 1999:228).2 In the 1980s the French Government began speaking of exclusion in reference to what was termed the ‘new poverty’ of long-term unemployment along with weakened family and social ties. A wide range of new social programmes aimed at fostering ‘integration’ were introduced in response. In the 1990s the concept developed a spatial application, referring to disadvantaged outer suburbs, with social programs being developed to combat ‘urban exclusion’.
The idea of social exclusion spread quickly through Europe in the late 1980s and 1990s, with countries such as Germany, Denmark, Portugal, Italy and Belgium, and later the United Kingdom and Ireland, establishing policies, institutions and programs to tackle social exclusion (Daly & Silver 2008; Silver 1994). However, the concept is most prominently linked with the European Union (EU). In 1989 the European Community’s Council of Ministers of Social Affairs passed a resolution to fight social exclusion and to promote integration (Silver 1994). The concept was used during the 1990s as a theme in a range of EU anti-poverty programs and research, including efforts to harmonise relevant data across member states. During that time the concept became tied to wider discussions of social and economic issues in Europe (Room 1995).
The EU established an Observatory on National Policies to Combat Social Exclusion, which was responsible for examining social exclusion policies throughout European countries (Jones & Smyth 1999). At the Lisbon Summit in 2000, when the EU set objectives for economic and social development, social exclusion was adopted as a ‘social policy flagship’ (Daly & Silver 2008) and the ‘Social Inclusion Process’ was established to foster national strategy development and policy coordination between member states. Through this process the EU provides guidance and promotes the involvement of stakeholders in policy making, as well as providing a common framework against which achievements and policies can be compared and evaluated (EC 2009). Poor performance of the European economy and slow progress towards the objectives and targets by member states led to the second phase of the Lisbon Strategy (2005–10) having a more narrow focus on growth and employment (Buckmaster & Thomas 2009). One priority area became ‘active inclusion’, promoting the labour market integration of the most disadvantaged groups capable of working (EC 2009).
A policy model that has emerged within this context is that of ‘flexicurity’. It first appeared in European academic discourse in the mid-1990s, addressing social and economic policies in general and employment policies in particular. The European Commission (EC) has become a proponent, with flexicurity playing a role in the revised Lisbon Strategy (EC 2007; Keller & Seifert 2009; Keune & Jepsen 2007; Madsen 2002). It is considered an attempt to turn around highly regulated declining welfare states in Europe into high performing states without compromising the European social model (Larsen 2008:2).
The European Commission defines flexicurity as ‘a comprehensive approach to labour market policy, which combines sufficient flexibility in contractual arrangements—to allow firms and employees to cope with change— with the provision of security for workers to stay in their jobs or be able to find a new one quickly, with the assurance of an adequate income in between jobs’ (EC 2007:10). In Denmark, where flexicurity was first introduced in the mid-1990s, the model consists of government policies which provide income support, retraining and life-long learning systems, with a view to balancing the need for workplaces to be flexible against the needs of workers for employment security (Auer & Lansbury 2009). (See Appendix 1 for further details).
In the United Kingdom the term social inclusion was used in the non-government sector and academic research during the early 1990s in order to broaden the understanding of poverty. Following its election in 1997, the Blair Government established a Social Exclusion Unit within the Cabinet Office (Jones & Smyth 1999) and moved quickly to introduce a number of key policy initiatives in areas such as education, health, employment and housing. As an example, the Sure Start program commenced in 1998 and responded to the multidimensional nature of social exclusion by integrating services such as early education and childcare, support services for parents (including employment services), and child and family health services within Sure Start Children’s Centres (DCSF 2009).
Beyond Europe, the concept of social exclusion emerged in Asia during the mid-1990s (Sen 2000), at which time the International Labour Office launched a research program based around this area (Jones & Smyth 1999). More recently, it has been taken up in policy discussion in South America (Daly & Silver 2008), and in Australia.
1.2 Social inclusion in Australia
In the late 1990s Jones and Smyth (1999) wrote a paper exploring the concept of social exclusion and its potential as a framework for social policy analysis in Australia. Since then use of the concept has grown among academic researchers in Australia, as well as in the community sector. For example, by 2004 the Brotherhood of St Laurence was using it as a major framework to structure its research and programs.3
Several state governments have adopted the concept:
Social inclusion as a concept has gained prominence under the current federal government.4 A broad social inclusion agenda to address disadvantage and maximise participation was promoted as part of its 2007 election policy platform, with one election policy document stating, ‘Workforce participation is a foundation of social inclusion; it creates opportunities for financial independence and personal fulfilment’ (ALP 2007:3). After being elected, the Deputy Prime Minister was sworn in as Minister for Social Inclusion (ALP undated) and the federal government established the Australian Social Inclusion Board (ASIB) to act as the main advisory body in the area, as well as a Social Inclusion Unit (SIU) in the Department of the Prime Minister and Cabinet (Australian Government 2009b).
The use of the term social inclusion in the Fair Work Act 2009 signifies the growing importance of the concept to Australian policy. Future policy developed in Commonwealth agencies will be required to use the social inclusion method of policy design and delivery through a ‘toolkit’ which aims to ‘help in the task of translating social inclusion principles and priorities into the daily practice of government and public administration’ (Australian Government 2009a:foreword).
According to Scutella, Wilkins and Horn (2009), the integration of social inclusion and Sen’s capabilities approach have been influential in directing the social inclusion agenda in Australia, including within the federal government’s SIU.5 In summary, the capabilities approach is concerned with an individual’s freedoms or ‘the capabilities … he or she enjoys to lead the kind of life he or she has reason to value’ (Sen 1999:87). According to this approach poverty is considered to be a deprivation of such capabilities rather than simply having a low level of income. However, Sen acknowledges that income is ‘an important means to capabilities’ (Sen 1999:89), with its impact on capabilities varying across communities, families and individuals and being contingent on factors such as age, gender and location.
Place and location have also been significant to the understanding of and response to social exclusion in Australia. Atkinson made the point that exclusion may be a ‘property of a group of individuals rather than of individuals’ (1998:14) and therefore manifest at a community level (geographic or social community). In Victoria, the Government has been attempting to address locational disadvantage through place-based initiatives such as Neighbourhood Renewal and Community Renewal. The spatial dimension is also reflected in the Australian Government’s conceptualisation of social inclusion, as evidenced by the Deputy Prime Minister’s reference to Tony Vinson’s ‘postcode poverty’ work around geographic concentrations of disadvantage (Gillard 2008 in Hayes, Gray & Edwards 2008).
2 Definitions of social exclusion/inclusion
There is no universal or generally accepted definition of either social inclusion or exclusion. Silver (2009) argues that inclusion is not simply the opposite of exclusion, but that in fact they are products of different motivations and functions and involve different mechanisms and agents. On the other hand, the Australian literature generally deals with social inclusion and exclusion together, treating them as opposite ends of the spectrum (for example, Buckmaster & Thomas 2009; Hayes, Gray & Edwards 2008; Scutella, Wilkins & Horn 2009). For example, Hayes, Gray and Edwards (2008:4) refer to ‘social exclusion and inclusion as two ends of a single dimension’, and state that it is difficult to discuss social inclusion without discussing the literature on social exclusion.
The UK Government’s Social Exclusion Unit (SEU)6 provides this commonly cited definition of social exclusion:
a shorthand label for what can happen when individuals or areas suffer from a combination of linked problems such as unemployment, poor skills, low incomes, poor housing, high crime environments, bad health and family breakdown (SEU 1997 cited in Hayes, Gray & Edwards 2008:4).
This definition views social exclusion as an outcome rather than a process. This is in contrast to many other definitions, including Pierson’s, which appears to be favoured by the Australian Social Inclusion Board (ASIB):
Social exclusion is a process that deprives individuals and families, and groups and neighbourhoods of the resources required for participation in the social, economic and political activity of society as a whole. This process is primarily a consequence of poverty and low income, but other factors such as discrimination, low educational attainment and depleted living environments also underpin it.
Through this process people are cut off for a significant period in their lives from institutions and services, social networks and developmental opportunities that the great majority of a society enjoys (Pierson 2002 cited in ASIB 2009:vii).
This definition emphasises the idea of a process that denies people the appropriate resources for full participation in society. Whether social exclusion is seen as a process or outcome, the measurable indicators of it may be similar, but understanding it as a process allows greater scope for intervention and change.
Some definitions emphasise the persistence of social exclusion. The SEU understanding of social exclusion highlights an inter-generational quality or a ‘vicious cycle’ (Vinson 2009), while the European Union states that ‘some disadvantages lead to exclusion, which in turn leads to more disadvantage and more social exclusion and ends up with persistent (multiple) disadvantages’ (Eurostat Taskforce on Social Exclusion and Poverty Statistics 1998:25).
In contrast to many other definitions, Burchardt, Le Grand and Piachaud (1999) contend with the notion that, for some people, social exclusion may reflect an element of choice:
An individual is socially excluded if (a) he or she is geographically resident in a society but (b) for reasons beyond his or her control, he or she cannot participate in the normal activities of that society, and (c) he or she would like to so participate (Burchardt, Le Grand & Piachaud 1999:229).
However the authors’ final definition omits this element of choice. The authors are troubled that self-exclusion of the poorly resourced may not in fact be truly voluntary if, for example, they have withdrawn themselves from a society hostile to them. Moreover, they are concerned that while self-exclusion may be favoured by individuals themselves (including by some who are well resourced) it may not be a positive thing for the broader society.
Levitas et al. (2007:21) examine a range of definitions and conclude that the common element between them is that they refer to ‘structures, processes and characteristics of society as a whole, as well as to the experience of individuals situated within these’. They develop this composite definition:
Social exclusion is a complex and multi-dimensional process. It involves the lack or denial of resources, rights, good and services, and the inability to participate in the normal relationships and activities, available to the majority of people in a society, whether in economic, social, cultural or political arenas. It affects both the quality of life of individuals and the equity and cohesion of society as a whole (Levitas et al. 2007:25).
According to Saunders, Naidoo and Griffiths (2007), an advantage of this definition is that it is unambiguous in expressing the idea that social exclusion is broader than poverty. Moreover, they argue, it calls attention not only to what social exclusion is, but to the outcomes it yields, for individuals and for society, in the short term and over the longer term.
Tsakloglou and Papadopoulos, drawing on a range of literature, summarise some key components of social exclusion. They conclude that the concept is multidimensional, dynamic and relative and recognise that exclusion is beyond the responsibility of the individual. Social exclusion is also relational in nature and indicates ‘a major discontinuity in the relationship of the individual with the rest of society’ (2002:212–213).
Social inclusion is less commonly defined than social exclusion. The early response to social exclusion in France was spoken of in terms of ‘integration’ and ‘solidarity’ rather than ‘inclusion’ (Silver 1994:538–542). More recently, European Union (EU) documents on the Social Inclusion Process do not explicitly define social inclusion, but rather present it as a response to poverty and social exclusion that enhances solidarity and social cohesion (EC 2009).
There is also no formal, published definition of social inclusion from the Australian Government’s Social Inclusion Unit (SIU) or ASIB, but instead a set of principles around social inclusion (see below) and a discussion of what it means to be socially included:
Being socially included means that people have the resources (skills and assets, including good health), opportunities and capabilities they need to: Learn—participate in education and training; Work—participate in employment, unpaid or voluntary work including family and carer responsibilities; Engage— connect with people, use local services and participate in local, cultural, civic and recreational activities; and Have a voice— influence decisions that affect them (Australian Government 2009a:Foreword).
Under the South Australian Social Inclusion Initiative, social inclusion is:
… the creation of a society where all people feel valued, their differences are respected and their basic needs—both physical and emotional— are met ... Social Inclusion is about participation; it is a method for social justice. It is about increasing opportunities for people, especially the most disadvantaged people, to engage in all aspects of community life (Government of South Australia 2009).
Drawing on the above discussion, social inclusion can be broadly understood as the process or means by which individuals and groups are provided with the resources, rights, goods and services, and opportunities to engage in cultural, economic, political and social aspects of life.
The Australian Government has adopted a set of ‘social inclusion principles for Australia’. They consist of three aspirations and eight approaches.7 The three aspirations include:
The eight approaches of social inclusion are:
These principles appear to reflect a range of influences. The emphasis on the involvement of stakeholders and the integration of policy responses and data to inform policy is consistent with the EU Social Inclusion Process. The priority given to early intervention was also seen, for example, in the Sure Start program in the UK. And place-based interventions have been a focus in European countries such as France and the UK, and in parts of Australia (e.g. Victoria).
3 Dimensions of social exclusion
The social exclusion literature identifies a number of dimensions of social exclusion, which vary according to the particular framework used.8 The following discussion draws upon three of the more well-known frameworks, namely those that were developed by Pierson (2002), the Poverty and Social Exclusion (PSE) survey in Saunders, Naidoo and Griffiths (2007), and Burchardt, Le Grand and Piachaud (2002). (Further details on these frameworks are provided in Appendix 2).
In total, these three frameworks identify six different dimensions of social exclusion. Four are included in more than one framework:
1. exclusion from the labour market
2. exclusion from adequate resources
3. exclusion from social support and networks
4. exclusion from services.
The other two dimensions drawn from these frameworks are:
1. exclusion resulting from being located in a particular area
2. exclusion from local and/or national decision making.
A final dimension that is included in other frameworks and referred to in later sections of this paper is:
1. exclusion through poor health and/or wellbeing.9
A summary of these seven dimensions follows:
4 Workforce participation and social inclusion
As individuals can be affected by multiple and overlapping dimensions of exclusion, some researchers argue for a ‘holistic’ approach to social exclusion across various dimensions (EC 2009; Perkins 2008). According to this view, confining an understanding of the term ‘social exclusion’ (or ‘social inclusion’) to a context of paid employment devalues other forms of contribution and participation, and therefore a wider understanding of the multidimensional causes and processes of social exclusion is required.
This paper recognises that engagement in paid work is not the only route to social inclusion, that not all people have a capacity for paid work and that other activities, such as caring roles or volunteer work, are valuable forms of contribution. However, workforce participation is a key protective factor against social exclusion and has major role in facilitating social inclusion.
The Fair Work Act 2009 refers to social inclusion only in a context of increased workforce participation, and as such the remainder of this paper concentrates on this dimension of social inclusion. However, throughout this section, discussion of the potential effects from being in paid work extends into other dimensions, such as access to resources and social networks. The first part of this section reviews some of the ways in which workforce participation is associated with a range of positive outcomes and could be seen as promoting social inclusion. The second part considers aspects of paid work that potentially reduce the scope of paid work to achieve social inclusion. It is important to note that the literature surveyed in this section is almost exclusively concerned with associations between labour market status or characteristics of work, and a range of outcomes in areas such as resources and health; it does not provide evidence of any causal links.10
4.1 Paid work as a facilitator of inclusion
Paid work could be seen as promoting social inclusion by its impact on:
Discussion about these relationships is provided in the following sections.
4.1.1.1 Income and access to goods, services and credit
Paid work provides people with the income (through wages and salaries) that enables them to meet needs such as food, housing and clothing, and to purchase other goods and services.
The Household Income and Labour Dynamics in Australia (HILDA) Survey12 provides a rich longitudinal data source to examine the impact of paid work on a person’s resources and overall living standards. Two studies13 cited below compare groups of employees defined by their earnings relative to the then Federal Minimum Wage (FMW). A current limitation of the HILDA Survey is that by not ascertaining the industrial instrument through which participants are paid, analysis of employees reliant on minimum wages is not feasible.
Dockery, Ong and Seymour (2008) using 2006 HILDA data find that being unemployed is associated with greater constraint on consumption of goods and services and capacity to save than being employed. They find the following (statistically significant) results:
Long-term unemployment in particular has been found to have a long-term impact on individuals’ resources including lower employment rates, lower wages if a person is re-employed and long-lasting negative impacts on future earnings (Gray et al. 2009).
Taking a multidimensional approach to exploring living standards, Hahn and Wilkins (2008) find that only a very small proportion of adult workers have a low standard of living. Using 2001–06 HILDA data, they find that:
Using data from the second wave of the HILDA Survey, Breunig and Cobb-Clark (2005) find that financial hardship which is closely related to social exclusion is experienced by one in five
(22.8 per cent) Australian families in the bottom income quintile (2005:17). They also find that the incidence of financial hardship declines as equivalent income levels increase.
Employment also facilitates access to credit (Burgess & Mitchell 1998), along with other financial and insurance services (Atkinson 1998). In the Australian context, ‘financial exclusion’ can be understood as a lack of access to low-cost, fair and safe financial products (Howell & Wilson 2005). While some degree of financial exclusion is evident across a broad range of income levels, the two groups that are particularly at risk are: 1) those with work histories involving unemployment, discontinuous work, or casual work; and 2) low-income earners with little or no savings and a lack of assets, leading to a lack of collateral when attempting to gain loans or credit (Chant Link 2004a).
There are no reliable estimates of the prevalence of financial exclusion in Australia. While not necessarily indicative of financial exclusion, a strong association has been found between employment and ownership of financial products such as savings and investment products, credit and loan products and insurance. Analysis of finance data involving over 50 000 Australians shows that 18 per cent of unemployed people own no financial product at all or only a transaction account, compared with 2.5 per cent of employed people (Chant Link 2004b:9). People in paid employment are also much more likely to have superannuation savings, major credit cards and home loans and more likely to have a range of insurance products, investments and personal loans (Chant Link 2004b:19–20).
4.1.1.2 Human capital
Another resource that can be developed through workforce participation is human capital. Engagement in paid work generally provides people with specific work experience that, in combination with skills, education and training, potentially expands their work opportunities, including work with higher responsibilities and/or higher remuneration.
The workplace is an important learning environment, and workplace provision of training can enhance an individual’s human capital (Poell et al. 2006) and can substantially improve workers’ future earning prospects (Booth & Bryan 2006). Informal on-the-job learning is very important; however, formal learning provides qualifications that may be used to secure future jobs (Smith et al. 2002). According to the most recent Australian Bureau of Statistics (ABS) survey of Employer Training Expenditure and Practices, 81 per cent of employers provided some form of training during the financial year ending June 2002. The majority provided unstructured training and 41 per cent provided structured training (ABS 2003b:3).
Provision of structured training varied considerably by employer type. It was highest amongst public sector employers and large employers. It also varied by industry, for example, almost 90 per cent of employers in Government administration and defence and Electricity, gas and water supply provided structured training, compared with less than 20 per cent of employers in Transport and storage (ABS 2003b:4). Certain employee characteristics are also important. Richardson’s (2004) analysis of the 1997 ABS Survey of Education and Training, a survey of employees, finds that those with the lowest levels of education (less than Year 12) and those in lower paid lower status occupations report receiving less of the more formal enterprise training. She finds no evidence of a correlation with gender or age, but that those with lower English proficiency are disadvantaged. Almeida-Santos and Mumford (2004), using the employer–employee linked data from the 1995 Australian Workplace Industrial Relations Survey, find the probability that an employee has recently trained is negatively associated with potential experience, lower education levels, longer current job tenure and part-time or fixed-term employment status. The authors did not find evidence of discrimination related to demographic characteristics, such as gender, race or parenthood, in the provision of job-related training.
Australia has lower job tenure when compared with 17 other Organisation for Economic Co-operation and Development (OECD) countries (listed in Figure 1.1, Appendix 4). This in part can be explained by Australia’s relatively large job-to-job flows and relatively high proportion of younger people (aged 15 to 24 years) in employment (international comparisons of job tenure are discussed in more detail in Appendix 4). Carroll and Poehl (2007) find that for most people these large job-to-job flows in Australia result in a smooth transition between jobs. Analysis of HILDA data shows that job mobility generally results in better labour market outcomes for those affected. Movement between jobs leads to more sizeable earnings increases for those who change jobs compared with those who do not, and more often reflects a change from part-time to full-time employment (Wilkins, Warren & Hahn 2009).
The picture is less clear with regard to job mobility when the current work is at the lower end of the earnings distribution or of a non-standard form. Some research supports the ‘stepping stone’ theory that casual or low-paid work leads to better work opportunities, at least for some groups. For example, research by Dunlop (2000), that used data from the ABS longitudinal Survey of Employment and Unemployment Patterns conducted from 1995 to 1997, showed that 45 per cent of adults on or just above the then minimum wage15 moved within a year to higher-paid employment, while 36 per cent stayed in work in the same pay range, and around one in eight experienced a period of joblessness (Dunlop 2000:23). The groups of workers with the best earnings mobility outcomes were men, those aged 30 or under and those residing in urban locations (Dunlop 2000:42–43). Richardson’s (2002) review of the international literature also finds that low-wage jobs are an important pathway to work for young people with low levels of education. On the other hand, Perkins and Scutella (2008) report evidence of low-paid employees cycling between ‘low pay’ and ‘no pay’, and/or enduring lengthy periods in low-paid work (Perkins & Scutella 2008:107).
Using HILDA data, Buddelmeyer and Wooden (2008) find that casual employment represents an effective pathway for both young people and men for moving into non-casual employment. Casual employees and employees at the lower end of the earnings distribution are at greater risk of future unemployment or joblessness than other employees. However, their longer-term outcomes are considerably better than those of jobless people (Buddelmeyer, Lee & Wooden 2009; Buddelmeyer & Wooden 2008). Also using HILDA data, Mitchell and Welters (2008) find that casual workers in highly casualised industries, smaller firms and non-metropolitan labour markets have a lower chance of transitioning to non-casual employment than other casual workers. Through further analysis (Welters & Mitchell 2009) they also find that in respect to casual employment, longer tenure at an employer, and in an occupation, reduces the likelihood of transitioning to unemployment. (section 4.2 further discusses forms of employment that may inhibit social inclusion).
4.1.2 Social networks and support
The importance of social networks to job search and labour market outcomes is fairly well established (see for example Barbieri, Paugman & Russell 2000 and Stone, Gray & Hughes 2003). However, the way in which participation in the workforce in turn facilitates social connections has not been researched as thoroughly. Nevertheless, researchers have argued that work colleagues constitute an important network of social relations. Stone, Gray and Hughes (2003)16 claim that workforce participation provides the potential for further expanding one’s connections, including the types of ‘bridging and linking ties’ that are important to positive labour market outcomes. Wellman (1999), in his mapping of networks, found that co-workers are consistently named as members of what he terms an individual’s ‘personal community’. Dodds, Muhamad and Watts (2003) conducted a cross-country experiment in which email users attempted to relay a message to one of 18 target persons by forwarding messages to acquaintances who they considered ‘closer’ to the target than themselves. Although senders typically used friendships in preference to business or family ties almost half of these friendships were formed through either work or school affiliations, and the chains that were successful in reaching their targets relied disproportionately on professional ties rather than friendships and familial relationships (34 per cent compared with 13 per cent respectively).
Workplace relationships may contribute to social networks and support in a variety of ways. In a practical sense, professional relationships are considered important in career-building through finding jobs and opportunities for promotion (Sias & Cahill 1998; Stone, Gray & Hughes 2003). Workplace friends also provide emotional support and affirmation and can act as a buffer to job-related stress and improve job satisfaction—Godin and Kittell (2004) find that social support at work is important in reducing poor health outcomes. Workplaces may also foster support through mentorship, whether formally or informally. In evaluating mentoring programs in Australia MacGregor (2000) finds, in addition to the abovementioned benefits, improved career planning, confidence and technical competence.
4.1.3 Mental and physical health
In social science research, paid work has long been understood to have a core social role in terms of the way in which individuals perceive and define themselves. Some authors have argued that the work-identity nexus has now been weakened by, for example, new forms of work that do not provide a strong identification with an occupation (Sennett 1998), or by increased job insecurity and changing household patterns of paid work (Charles & James 2003). However, despite these developments, work is still considered a crucial context for identity development (Beck 2000; Charles & James 2003; Giddens 1991).
Some researchers see paid work as having the potential to strengthen self-esteem through providing opportunities to have efforts and achievements recognised or rewarded. Work can also enhance self-efficacy (a sense of mastery, autonomy) and self-integration (a sense of belonging) by providing a sense of purpose and an opportunity to contribute to common goals (Evans & Repper 2000; Siegrist 2000). Perkins’ (2006) review of Australian and international studies suggests these potential benefits exist for people with mental health or substance abuse issues, with some studies noting improved physical health outcomes from entering employment.
Similarly, researchers find adverse health effects, both mental and physical, to be associated with exclusion from the labour market. For example, Broom et al. (2006), using cross-sectional survey data for Australians aged 40–44, find that people who are unemployed, or not in the labour force, had higher odds of poor health (i.e. depression, poor physical health, poor self-rated health, higher number of GP visits) compared to those who are employed. Jose et al. (2004), after controlling for age, period and cohort effects, find a strong association between labour force non-participation and long-term health conditions, health risk factors (e.g. smoking) and health-related actions (e.g. consultations with doctors or specialists). Dockery, Ong and Seymour (2008) find an association between employment and higher levels of wellbeing; on average the unemployed people in the sample rated themselves significantly lower on self-assessed health and overall life satisfaction than those working in a low-wage or higher-paid job.
A recent AMP NATSEM report, using 2007 HILDA Survey data, confirms that poor health in turn affects the likelihood of employment, with more than half of working-age Australians with poor physical health not participating in the labour force (NATSEM 2009:10). Poor health also affects the amount of work undertaken— only 29 per cent of people in poor health are employed full-time, compared to 61 per cent of people in good health (NATSEM 2009:10)—which in turn affects a person’s capacity to earn income. If poor health is chronic, its impact on earning capacity is compounded, with the effects potentially lasting a lifetime.
As the AMP NATSEM results suggest, a common difficulty in the literature is establishing the direction of causation between health status and labour force status. Applying a simultaneous equation model (to the first four waves of HILDA data) to address this difficulty, Cai (2007) finds that the effect of workforce participation on health differs by gender, with workforce participation resulting in a positive health effect for women and a negative effect on men’s health.
As further evidence of paid work as a facilitator of social inclusion, Gray et al. (2009) find, from reviewing a range of literature, that unemployment, particularly long-term unemployment, is associated with a number of negative impacts, including:
In addition, the European Union acknowledges that unemployment, particularly long-term unemployment, is a key cause of poverty and social exclusion (Atkinson, Marlier & Nolan 2004). People who are unemployed may lose confidence and motivation, lack appropriate skills and attract negative perceptions from some employers. Furthermore, they may lose contact with networks that could help them find employment (ASIB 2009:29).
4.2 Aspects of paid work that may inhibit social inclusion
While it is widely recognised that having a job is one of the key determinants of people’s ability to participate in society, the nature of employment may inhibit social inclusion as it may limit people’s capacity to spend time with their family, connect with others and contribute to their community voluntarily. The literature suggests that underemployment, non-standard working arrangements (e.g. casual work), long working hours, and tension between work and family responsibilities may be associated with a range of outcomes that may impede social inclusion.
Underemployed people (particularly those who experience underemployment for extended periods), may be at risk of social exclusion if their earnings are insufficient to provide them with an adequate income, or the security of their employment is tenuous (Millward et al. 1992). This problem is particularly relevant for women, and people with poorly recognised skills and qualifications (NZ Ministry of Social Development 2001; Wilkins 2007). Underemployment is an issue where there is not enough work and is therefore different from long work hours or the tension between work and family responsibilities. Obviously, more work is the solution to this issue.
In contrast to the pattern of unemployment, underemployment failed to recede during the recent economic boom in Australia and even increased slightly (Campbell 2008:156). Campbell suggests that the rise in underemployment during this period is related to the preference of employers – given the conditions that they face within their industries – to draw from a larger pool of ‘flexible’ labour. In the retail industry, for example, additional hours and shifts can be filled by underemployed workers at short notice to replace absences and respond to unexpected fluctuations of demand.
In September 2008 approximately 687 700 (or 23 per cent) of part-time workers would have preferred to work more hours. Of those workers, 49 per cent preferred to have longer part-time hours and 51 per cent preferred to work full-time (ABS 2008c:5). Around 46 per cent of underemployed part-time workers usually worked 15 hours or less (ABS 2008c:19). The duration of underemployment for part-time workers varied with age, with older people experiencing longer periods of underemployment. In September 2008, overall, the median duration of underemployment for part-time workers was 26 weeks. Older people generally had a longer period of underemployment than younger people. For example, under one-fifth (19 per cent) of 15–19 year old underemployed part-time workers had experienced insufficient work for one year or more. In contrast, 50 per cent of those aged 45–54 years, and 53 per cent of those aged 55 years and over had insufficient work for one year or more (ABS 2008c:7). The change in demand for labour during the current economic downturn has seen a rise in underemployment (ABS 2009a).
4.2.2 Non-standard work arrangements
Non-standard work arrangements in this context are taken to include casual employment without entitlement to paid leave, or employment involving regular ‘unsocial’ hours, that is, working often or almost always on weekends or evenings/nights past 9.00 pm. These arrangements may inhibit social inclusion, especially among people who would prefer alternative working arrangements. On the other hand, the availability of non-standard work may provide employment opportunities for some people who would otherwise remain jobless and thus may contribute to social inclusion.
As of 2007, 25 per cent of employees were employed on a casual basis (ABS 2009d:18), representing 2.1 million employees. Women accounted for over half (56 per cent) of all casual employees. Casual employees also tended to be young, with two-fifths of the casual workforce aged 15–24 years compared with 14 per cent of all employees (ABS 2009d:18).
While for some workers casual employment may be a preferred option, on several indicators, casual employment does not compare favourably to standard work arrangements:
The impact of casual employment on social inclusion is a contested area. Critics of the increase in casualisation are concerned that it raises the proportion of inferior jobs in the labour market— that is, jobs with low pay, no paid leave entitlements, low levels of training and job security. On the other hand, defenders of casual employment suggest it provides greater capacity for preferences to be matched within the labour market, citing measures of self-reported job satisfaction as evidence (Watson 2004). For example, Wooden and Warren (2003) using first wave HILDA data found that part-time casual employees were equally as satisfied with their jobs as permanent employees, although full-time casual workers—particularly male workers—were more dissatisfied than their permanent counterparts.
In response, Watson (2004) used HILDA data to assess casual jobs on the ‘objective’ measure of hourly rates of pay (controlling for certain individual and workplace characteristics). It would be expected that wages of part-time casual employees would include a premium of between 15 and 20 per cent (based on casual loadings in awards and agreements)19 ‘if they were being paid commensurate with comparable workers in permanent full-time positions’ (Watson 2004:13).20 However, Watson finds that male part-time casual employees earn only a modest premium of about 10 per cent over their permanent full-time counterparts. Female part-time casual employees earn an even more modest premium of between four and seven per cent. When Watson discounted the earnings of casual workers to take account of their loadings, he found that part-time casual employees are subject to an earnings ‘penalty’ in terms of a lower base rate of pay of between 12 per cent and 17 per cent (Watson 2004:12–13).
Welters and Mitchell (2009) argue that if secure and permanent employment was available, casual work would only likely be a first choice to those who do not intend to pursue a career in that line of work, for example students who use casual work to help support their studies. However, these authors hypothesise that when secure and permanent employment opportunities are limited, casual employment would also become an appealing alternative, if it provides a pathway to non-casual employment that would otherwise be impossible to attain for a person in unemployment. (Transitions between casual and non-casual employment were discussed in section 4.1.1.2).
Smith and Ewer (1999) challenge the notion that casual work is generally a matter of individual choice. They claim that:
… where workers express a degree of satisfaction with their casual work, this satisfaction derives from the regularity of their employment and the consistency of the work they received ... The absence of employment options, and the gendered division of domestic labour also influenced a ‘preference’ for casual work. Casual work may be preferred by women workers because of the perceived flexibility it provided in combining work and family responsibilities. Yet women’s experience of casual work also suggests that a refusal of an offer of casual employment for family oriented reasons would jeopardise future employment prospects (Smith & Ewer 1999:v).
Pocock, Buchanan and Campbell (2004)21 suggest that the potentially unfavourable conditions of casual employment mean these workers may find themselves marginalised, particularly in relation to workplace decision-making, task diversity and access to career paths. In addition, the precarious nature of much casual employment means that casual jobs do not offer sufficient security (Burgess & Campbell 1998b; Watson 2004), since casuals may not be given notice (or severance pay) in the case of dismissal and suffer uncertainty around pay amounts from period to period. While some casual workers keep their jobs for long periods, data from the ABS Forms of Employment Survey suggests employees without paid leave entitlements have shorter job tenure and expectations of ongoing tenure, when compared with employees with leave entitlements (ABS 2006c). In the labour market casuals are more likely to experience ‘job churning’, where they alternate in and out of work without finding a long-term job (ABS 1997a; Burgess & Campbell 1998a). On the other hand, ‘the part-time arrangements often associated with casual employment can help employees balance their work with other commitments, such as education and family responsibilities’ (ABS 2009d:8).22
Data from the ABS 2007 Survey of Employment Arrangements, Retirement and Superannuation indicate that nearly two in three workers (64 per cent) usually worked all of their hours during daylight hours (i.e. between seven in the morning and seven in the evening). The other 36 per cent of employed people usually worked some or all of their hours at night (i.e. between seven in the evening and seven in the morning) (ABS 2009c:26). Skinner and Pocock (2008), using the Australian Work Life Index (AWALI)23 2007 survey, find that women workers (index24 score 55.2), both part-time and full-time, are more affected than men (index score 50.9), despite women often requiring more flexibility due to parenting and/or caring responsibilities. They also find that working long and unsocial hours is associated with a worse work–life balance. Nearly a third (31.3 per cent) who regularly (often/almost always) work on weekends reported working long hours (48+ per week), as did 38.0 per cent of those who work evenings/nights, 40.3 per cent who regularly work both weekends and evenings/nights, and 13.6 per cent of those who mostly work weekdays before 9.00 pm (Skinner & Pocock 2008:49).
On the other hand, Baxter (2009) using time-use data from the first wave (2004) of the Longitudinal Study of Australian Children, finds that for families with young children, most non-standard work arrangements of parents (including evening/night work, contract work and multiple jobs) are not in themselves negatively associated with time spent with children; the exception being weekend work. The number of hours in paid employment has the strongest association with variations in parent-child time. Her analysis shows no difference in the total amount of parent-child time between parents for whom work start and finish times changed the most and those for whom they changed the least.
A person’s occupational skill level may also contribute to social exclusion by determining the proportion of a worker’s leisure time that coincides with that of their family. Rice and Lesnard (2008) highlight this issue when they rank a range of occupation classifications by their mean leisure time (in minutes) per day.25 After adjusting leisure time for the extent to which that leisure time ‘harmonises’ with friends and household members, they find that skilled occupations (e.g. professionals, tradespersons) generally improve their ranking, while the opposite is true for lower skilled occupations (e.g. labourers, elementary clerical, sales, and service workers).
4.2.3 Longer hours of work and work intensification
OECD figures show full-time Australian employees (excluding business owners) work an average of 44 hours a week, the longest in the western world26,and much longer than the ‘standard’ week of 38 hours (Fear & Denniss 2009:4). This is confirmed in the 2009 wave of the Australia at Work survey (van Woonroy et al. 2009).
Balancing work and family responsibilities requires juggling a number of conflicting priorities, which may be felt more intensely by those with fewer family or community supports. This may particularly be the case for employees with young children. In April 2009, the proportion of employed men and women with young children who reported that their work and family responsibilities were rarely or never in balance was 17 per cent (ABS 2009b:24). Almost two-thirds (64 per cent) of employed people aged 25–54 years with young children reported always or often feeling rushed or pressed for time, compared to almost half (49 per cent) of employed people without young children (ABS 2009b:25).
Using AWALI 2007 data, Pocock, Skinner and Williams (2007) find that 52.6 per cent of employees surveyed report that work sometimes, often or almost always affects their activities beyond work, and that longer hours of work are consistently associated with worse work–life outcomes, as work can impact employee activities outside work. In particular, they find that work can affect employees’ capacity to build and maintain connections with their community, friends and family (Pocock, Skinner & Williams 2007:1–2).
Work intensification, which generally refers to working longer hours and/or working harder within each hour of work, may inhibit social inclusion. Work intensification can occur within a context of reduced staffing levels and increased workloads (ACTU 2003), while other associated factors include: technological and organisational change; human resource policies that stimulate greater worker engagement (e.g. effort incentives); reduced union power and collective bargaining; and a higher degree of outsourcing to temporary agency and contract workers (Green 2004). Campbell (2007:17) attributes the emergence in Australia to employer pressures within a framework of weak working-time regulation.
As a measure of work intensification, the large-scale Australia at Work27 longitudinal survey asks participants to respond to the statement ‘more and more is expected of me for the same amount of pay’. Despite the excess labour that has materialised in the economy over recent months, reported levels of work intensification have not reduced, with around half of participants experiencing work intensification for the same pay; a finding that has been constant over the life of the survey (van Woonroy et al. 2009:88). The survey finds that work intensification is more likely to affect those in full-time work and those in secure permanent employment, while those in forms of employment with limited security of tenure (i.e. short-term casuals and fixed-term contract employees) report lower levels in work intensification and perceive greater control over their work hours (van Woonroy et al. 2009; van Woonroy et al. 2008).
Industry and occupation appear to be important determinants of work intensification. For example, Campbell and Peeters28 (2008) show that workers in the contract cleaning industry have experienced compressed work schedules (i.e. very short hours in individual jobs and high workloads), Willis (2005) presents the creation of the ‘personal service attendant’ in a hospital workplace (achieved through merging cleaning, nurse assistant, orderly and kitchenhand tasks) as a case study in work intensification.
4.2.4 Effect of employment arrangements on health
Research suggests that stimulating and challenging jobs provide a foundation for healthier workers, stronger communities, and other macro-level benefits (VicHealth 2006). However, certain types of employment arrangements, such as being in a casual job, being rostered, working longer hours, being underemployed, being in a job that is characterised by low levels of decision latitude, and high levels of job demand, have been found to be associated with poorer physical health, a higher rate of depression, and higher levels of disengagement from the community, friendships and family (Grzywacza & Dooley 2003:1750 &1756; Pocock, Skinner & Williams 2007:42; VicHealth 2006:13;).
VicHealth (2006)29 suggests that job stress is a widespread concern in Australia and other OECD countries. From a review of international literature, they suggest job stress is a commonly reported cause of lost workdays, high staff turnover, as well as being associated with health problems such as occupational illness, cardiovascular disease, immune deficiency disorders and gastrointestinal problems. A range of psychosocial working conditions such as excessive workload and pressure, lack of job control and unclear work roles have been found to be related to psychological ill health (including anxiety and depression) increased use of prescription medication and emotional exhaustion (Pocock, Skinner & Williams 2007; VicHealth 2006). In addition, VicHealth (2006) cites studies documenting associations between working conditions (including job stress, safety risks, and exposure to hazardous substances) and health behaviours (such as smoking, sedentary behaviour, poor diet and alcohol consumption). Other studies find that longer and/or excessive working hours (over 50 hours per week) are associated with higher body weight for men (VicHealth 2006:7–9) and reduced opportunities for activities outside work, including time for family or friends (Pocock, Skinner & Williams 2007).
As both the Council of the European Union (2009) and Grzywacza and Dooley (2003) contend, policies that promote job growth without giving attention to the overall quality of jobs may fail to safeguard health, wellbeing and social inclusion. Grzywacza and Dooley (2003) argue that transitions from what they call ‘optimal’30 jobs to what they call ‘barely adequate’31 jobs ‘might have comparable effects on health and wellbeing as transitions from employment to unemployment’ (Grzywacza & Dooley 2003:1759).
4.2.5 Other factors which may inhibit workforce participation and social inclusion
Other factors that may be associated with peripheral employment or unemployment include educational attainment, skill level, language (English as a second language), inadequate income, age, disability, child care, other caring responsibilities, having a criminal record, long-term unemployment and geographic location (ABS 2006; ABS 2003; ASIB 2009; Atkinson, Marlier & Nolan 2004; Baum & Mitchell 2008; Gray & Edwards 2009; Henry 2006; Henry & Jacobs 2007; Lam & Harcourt 2003; NILS 2004; Vinson, Rawsthorne & Cooper 2007; Visher, Winterfield & Coggeshall 2005).
Age discrimination remains a significant problem in the workplace. Recruitment and redundancy decision-making processes, employer attitudes, lack of training to update the skills and knowledge of older workers, and lack of flexible working arrangements all limit employment opportunities for older workers (Chartered Management Institute 2005:3–4). Health difficulties and disability also contribute, as they often preclude people aged 55 to 64 from participating in the labour force (ASIB 2009:28). Similarly, people with disability face greater barriers to participation and employment than many other groups in Australian society (Australian Human Rights and Equal Opportunity Commission 2005:1).
Caring responsibilities also impact on labour market participation. While carers do have relatively low employment rates ‘at least two-fifths of carers who are not employed say they would like to be in paid employment’ (Gray & Edwards 2009:16).
5 Indicators of social inclusion/social exclusion
This section examines a range of indicators that could be used to assess the extent and progress of social inclusion/social exclusion, either at a national level or within specific regions or demographic groups.
Appendix 5 lists indicators of social inclusion/social exclusion that have been previously used or proposed for each of the seven dimensions of social exclusion that were outlined in section 3. Seven frameworks are shown, in chronological order, those developed by or through: the Centre for the Analysis of Social Exclusion (CASE) at the London School of Economics; the European Union (EU); the UK Government; the New Policy Institute; the Poverty and Social Exclusion (PSE) survey; the Social Policy Research Centre’s Community Understandings of Poverty and Social Exclusion (CUPSE) survey; and the Australian Social Inclusion Board (ASIB). The Melbourne Institute of Applied Economic and Social Research/Brotherhood of St Laurence have also proposed a framework for measuring social exclusion in Australia, with a simple sum-score method applied to the selected indicators in each domain to assess the extent or depth of exclusion (see Appendix 6: Scutella, Wilkins & Horn 2009 and Scutella, Wilkins & Kostenko 2009). It is particularly useful to consider indicators developed elsewhere as a starting point, as the concept of social inclusion is still relatively new to Australia. In particular, as the framework developed by ASIB has been largely influenced by the EU there may be scope for comparisons with the EU’s own statistical analysis.
While these seven frameworks differ to some extent in their emphases, there is considerable common ground in the issues they cover, which include labour market disadvantage, joblessness, poverty and deprivation, lack of economic security, educational and health disadvantage, and disengagement from political and civil activity. Although, as shown in section 4, workforce participation may influence social inclusion across a number of dimensions, the following discussion is generally limited to those indicators relating specifically to labour market inclusion/exclusion that were developed by the ASIB (see Appendix 7).
These indicators should not be regarded as fixed: their definition and implementation will inevitably be refined and broadened as more experience is gained in their application, and in response to changing social and economic circumstances.
5.1 Labour force participation
The labour force participation rate of the Australian working-age population (aged 15 to 64 years) has increased in the past decade, from around 74 per cent in 1998 to 77 per cent in 2008 (ASIB 2009:20). While this is not amongst the highest rates in the Organisation for Economic Co-Operation and Development (OECD), it was higher than the 2008 OECD average of 71 per cent (OECD 2009:252). The participation rate remains higher amongst men (83 per cent) than amongst women (70 per cent), although this gender gap has narrowed considerably over time (ASIB 2009:19). However, the impact of the recent global economic downturn is already being felt with employment rates falling by a percentage point for both the total population and men in the working-age population, between 2007–08 and 2008–09 (ASIB 2010:24). On the other hand, Australia’s ranking relative to the rest of the world is likely to have improved since 2008, due to even greater increases in unemployment in other countries.32
Participation rates for prime-age workers (25–54 years) with no post-school qualifications remain significantly below those with post-school qualifications (around 10 percentage points for both men and women). The outcomes for those who have not completed school beyond Year 9 are especially poor – for example, for prime-working-age women the difference in participation rates between those who have not completed school beyond year 9 and those with post-school qualifications is 37 percentage points (Kennedy, Stoney & Vance 2009:24–25). This study, using Census data, does not control for age, in which older cohorts are less likely to have post-school qualifications.
Labour force participation remains far lower for some other particularly disadvantaged groups. For example the labour force participation rate for working-age Indigenous people was 57 per cent in the 2006 Census33, around 20 percentage points less than it is for all non-Indigenous persons. This gap is constant through all age groups (18–24, 25–34, 35–44, 45–54 and 55–64 years), although is only half for the 15–17 year age group (ABS 2008b:80).
Migrants have a slightly lower participation rate than people born in Australia—when adjusted for differences in age structure34, it is 62 per cent compared with 67 per cent for Australian-born people (ABS 2006b:131). However, those arriving under humanitarian visas have particularly low labour force participation rates— for example, for one cohort of the Longitudinal Survey of Immigrants to Australia only 28 per cent were in the labour force even 18 months after arrival and 16 per cent were employed (NILS 2004:13).
Single parents, in particular single mothers, have lower employment rates than partnered parents. In 2009, the annual average employment rate of single parents with dependent children was 59 per cent (compared with 79 per cent of partnered parents), having increased from 50 per cent in 200135 (ABS 2009f) and 45 per cent in 1993 (AFPC 2009:98). Despite this improvement, Australia has the fifth lowest employment rate for single parents in the OECD (Whiteford 2009:24) with an employment rate that was about 20 percentage points below the OECD average in 2007 (Hayes, Gray & Edwards 2008:24).
5.2 Employment rate, and employment of older workers
The steady increase in the participation rate in recent years has been accompanied by a marginally greater increase in the employment rate, which rose from around 68 per cent in 1998 to 73 per cent in 2008, and by more for women than for men (ASIB 2009:26). However, the increased female employment has been relatively concentrated in part-time employment, which may have implications in terms of access to training and career development, as well as permanency of employment and employment benefits.
The increase in employment in recent years has been most pronounced in the 55 to 64 year age group, amongst whom 66 per cent of men and 49 per cent of women were in paid work in 2008, compared with 57 and 31 per cent, respectively, in 1998. For an increasing number of older Australians retirement intentions are changing, with more intending to retire after the legally required age of 65 years and some not intending to retire at all (ASIB 2009:26).
5.3 Long-term unemployment rate
Long-term unemployment36 is a key cause of poverty and social exclusion (Australian Social Inclusion Board, 2009; Atkinson, Marlier & Nolan 2004). People who are unemployed for long periods may lose confidence and motivation, lack appropriate skills and attract negative perceptions from some employers. Furthermore, they may lose contact with networks that could help them find employment.
In 2008 there were 70 800 people in Australia who were long-term unemployed, representing 0.6 per cent of the population (ASIB 2009:29). In Australia, long-term unemployment represents a small proportion of total unemployment. In 2008, unemployment of more than 12 months duration represented 14.9 per cent of total unemployment, well below the total OECD average of 25.9 per cent, and around two and half times less than the European average (OECD 2009:271).
5.4 Persons living in jobless households37
Analysis of Household Income and Labour Dynamics in Australia (HILDA) data of households with prime-age adults (25–54 years) who were not full-time students, finds that 10 per cent of prime-age adults lived in jobless households in any one year (Headey & Verick in ASIB 2009:33). The risk of a child living in income poverty38 depends upon the amount of paid work in their family as a whole (ASIB 2009). As of 2008, the proportion of all Australian people living in jobless families with children aged less than 15 years was 12 per cent (although this is considerably lower than in 1998, when it was 19 per cent). Lone parent families comprise around 72 per cent of all jobless families (Whiteford 2009:9), with 41 per cent of single parent families being jobless in 2008 compared with around 4 per cent of couple families (ASIB 2009:32). The relatively low levels of labour market participation of single parents and the growth in the number of these households are major contributing factors towards the comparably high incidence of children in Australia growing up in jobless families, with Australia recording the fifth highest level in the OECD of jobless households with children (Whiteford 2009:22).
5.5 People with a mild or moderate disability who are working
According to the Australian Bureau of Statistics (ABS) 2003 Survey of Disability, Ageing and Carers, one in five people in Australia (3 958 300 people or 20.0 per cent) has a reported disability (this rate is similar for males and females).39 Employment restrictions apply where because of their disability people are either restricted in the type, or number of hours, of work they can do; require a modified working environment; or are not able to work. Participation in employment generally decreases as the severity of disability increases. The participation rate for those with either a mild and moderate disability and without specific limitations or restrictions was approximately 50 per cent in 2003, compared to around 80 per cent for those with no reported disability (ABS 2004:3).
5.6 Geographic disparity in employment rates
Rates of employment and labour force participation are central indicators in mapping relative disadvantage at the suburb or postcode level (see for example, Baum & Mitchell 2008; Vinson, Rawsthorne & Cooper 2007).40 In Australia some labour force regions appear to experience persistent labour market disadvantage (Henry 2006). These regions, which account for approximately 10 per cent of the total labour force, include Wide Bay-Burnett in Queensland; Richmond-Tweed, Mid-North Coast, and Illawarra in New South Wales; North Western Melbourne in Victoria; Northern Adelaide in South Australia; and Greater Hobart-Southern and Mersey-Lyell in Tasmania. Regions with persistent disadvantage had unemployment rates ranging between approximately one and four percentage points more than the national average (Henry 2006:75).
Employment is generally seen as safeguarding against social exclusion; however, people may remain socially excluded if their earnings are insufficient to provide them with an adequate income. In some countries ‘in-work poverty’ affects a large number of people, and is linked to low pay, low skills, and precarious (often part-time) employment (EC 2006:18; OECD 2009).
According to Healy and Richardson (2006:28), 10 per cent of adult employees receive an hourly wage of less than or equal to the then Federal Minimum Wage (FMW), and another nine per cent of adult employees have wages of up to $2.20 per hour above the then FMW. McGuinness, Freebairn and Mavromaras (2007:11) find that 12.5 per cent of adult employees earned below 110 per cent of the then minimum wage in 2004 (based on the 2003 Safety Net Review decision of the Australian Industrial Relations Commission), of which five per cent are estimated to be earning below this. Hahn and Wilkins (2008:23) find that in 2006 around 17 per cent of adult employees earned below 120 per cent of the then FMW. They do not find a high prevalence of in-work poverty in Australia, and find that for many of those at the lower end of the earnings distribution experiencing low living standards, these do not persist over a period of four years (Hahn and Wilkins 2008:66). This is consistent with a recent OECD review of international evidence, which finds that Australia is one of a small number of countries with relatively low rates of in-work poverty (OECD 2009:179).
Both Hahn and Wilkins (2008:39, 43 & 58) and the OECD (2009:167 & 181–183) also find that where in-work poverty exists in Australia it is likely to be associated with relatively limited labour market engagement, such as working part-time rather than full-time, and being a one-earner family (Healy & Richardson 2006:5; Whiteford 2009:30).
Whiteford also finds that across OECD countries, ‘on average, only 30 per cent of poor families with children are jobless and most child poverty is found in families where at least one parent is in paid employment’. The reverse is true, however, for Australia, where around 70 per cent of poor children live in jobless families (Whiteford 2009:4). In addition, Australia has the second lowest poverty rate in the OECD for lone parents in paid work, and for couples with either one or both parents in paid employment, poverty rates are also among the lowest in the OECD (Whiteford 2009:30). He further argues that all countries with low child poverty rates (under five per cent) ‘combine both effective redistribution and low rates of family joblessness’. According to Whiteford, Australia seems to have one of the most effective systems of redistribution across OECD countries, but ‘the high level of family joblessness keeps child poverty rates about twice as high as the best performing countries’ (Whiteford 2009:4).
5.8 Proportion of young people not in employment, education or training
While this indicator is not included in the social inclusion/exclusion frameworks listed above, given the importance of young people’s engagement in employment and education/training in the post-compulsory education years for future labour market outcomes, and potentially, social inclusion, it is included here.
Labour force participation rates among all teenagers fell to below 55 per cent in the early 1990s, then rose and were relatively stable for a lengthy time at just under 60 per cent. However, the most recent data for 2009 indicate a fall in this figure, to 56.7 per cent. Among all 20 to 24 year olds, the rate of labour force participation stayed around 80 per cent across most of the period between 1989 and 2009, but also declined between 2008 and 2009 (Foundation for Young Australians 2009:38). According to OECD figures, in 2006 approximately two-thirds (66 per cent) of those aged 15 to 19 years in Australia who were not in education and training were employed. For those aged 20 to 24 years, the rate was 81 per cent. In comparison with the OECD average, employment rates in Australia were higher by about 13 per cent for teenagers and eight per cent for young adults in 2006. These figures, however, predate the global financial downturn (Foundation for Young Australians 2009:42).
The proportion of 15 to 20 year olds not in employment, education or training (NEET) was eight per cent in 2008, having fallen from 14 per cent in 1993 (Pech, McNevin & Nelms 2009:20). However, this annual average figure had increased to 10 per cent over the 12 months to October 2009, suggesting that young people are one of the groups most adversely affected by the recent economic downturn.41
Nevertheless, there is evidence to suggest that the labour market transitions of young people in Australia compare favourably to those in other OECD countries. Australia’s NEET rate for 15 to 24 year olds in 2005 was considerably lower, at 9.6 per cent, than the OECD average of 15.6 per cent (OECD 2008:68–69).
6 Minimum wages and social inclusion/exclusion
While researchers have not explicitly focused on the links between minimum wages and social inclusion/exclusion, there have been numerous studies with respect to the relationship between minimum wages and various dimensions of social inclusion/exclusion, including participation in the labour market and income. This section outlines the possible links between minimum wages and these dimensions.
6.1 Minimum wages and participation in paid work
As discussed in section 4, participation in paid work promotes social inclusion not only through a person’s inclusion in the labour market, but also potentially through other benefits from working such as increased resources, improved access to social networks and support, and better physical and mental health.
All other things being equal, higher minimum wages raise the financial incentives for people who are otherwise jobless or underemployed to take up, or increase their hours of, employment. The strength of these incentives also depends upon the tax/transfer system—in particular how much extra income a person retains from working after taking into account their taxation liabilities and reductions in income transfers or benefits, such as a health care card. These in turn will depend upon the person’s household situation. Research has shown (e.g. Harding et al. 2006) that, in Australia, most people have a considerable financial incentive to seek employment in terms of the resultant increase in household income. However, there may be other factors apart from financial incentives (e.g. placing a high value on caring for one’s children) that determine whether a person ultimately decides to look for a job or increase their work hours.
While minimum wages may have a positive effect on how much labour people supply, the overall effect on the number of people in paid work also depends upon how much labour businesses demand. Research into the effects of minimum wages on employment, mostly from overseas, has yielded diverse results. A large number of studies have found that minimum wages have a negative effect on employment42 (Baker, Dwayne & Shuchita 1999; Leigh 2007; Neumark 2001; Neumark & Wascher 2008; Neumark & Wascher 2006; Singell & Terborg 2006). However there is also a body of recent research that finds insignificant (both statistically and numerically) negative effects (for example ACIRRT 1999; Burkhauser, Neumark & Wascher 2000; Couch & Wittenburg 2000; Machin, Manning & Rahman 2003; Sabia 2009; Sabia 2008). Further, other studies have found zero or positive employment effects (for example Card & Krueger 2000; Dickens, Machin & Manning 1999; Doucouliagos 2009; Machin & Manning 1999; Stewart 2004).
Complicating these findings is the possibility that the effects of minimum wages will vary by country/region, industry/occupation, and/or demographic group. Indeed recent analysis by Dickens, Riley and Wilkinson (2009) using a range of methods, data sources and years, finds the introduction and subsequent upratings of the UK National Minimum Wage had mixed effects on employment that varied by gender and the given year analysed as well as choice of data source and comparison group.
As Rodgers and Rubery (2003) and Gregg (2000) suggest, the mechanism whereby a minimum wage has an impact on employment is complex and depends on many factors, such as:
As discussed above, participation in the workforce can help to develop a person’s human capital, providing further opportunities for paid work, and therefore potentially having a positive impact on social inclusion. The specific role of minimum wages in human capital development is unclear. As discussed earlier, the evidence is mixed with respect to the ‘stepping stone’ theory, although certain groups are thought to benefit more than others (see sections 4.1.1 and 4.2.2). Focusing specifically on workers earning at (or below) the then applicable minimum wage, McGuinness, Freebairn and Mavromaras (2007:29–30) looked at employment transitions between 2001 and 2004 using Household Income and Labour Dynamics in Australia (HILDA) data, and found that almost 60 per cent of those working full-time at or below the minimum wage in 2001 had made a transition to higher paid employment by 2004, with the figure being 40 per cent for those working part-time hours.
Work-related training is also a potentially important element of human capital development. The Organisation of Economic Co-operation and Development argues that minimum wages, by compressing the wage relativities between higher skilled and lower skilled workers, might reduce the incentives for employers to invest in training among the lower skilled (OECD 2007b). However some literature from the UK suggests that minimum wages are actually associated with a small increase in work-related training for the low paid (Arulampalam, Booth & Bryan 2002; Booth & Bryan 2006), with one study finding that the introduction of a minimum wage in Britain increased the probability of training incidence/intensity by 8 to 11 per cent for affected workers (Arulampalam, Booth & Bryan 2002:27). However Dickinson (2007), using an alternative methodology and data source found the introduction and subsequent increases to the National Minimum Wage in the UK did not have a significant impact on the provision of job-related education or training.
In the absence of any other effects, an increase in minimum wages will raise the earnings, and therefore the incomes, of employees (thus assisting with one of the dimensions of social inclusion, as a rise in minimum wages would in most cases increase the resources available to employees). In practice, the extent to which an increase in wages raises incomes depends upon a person’s taxation liabilities and withdrawal of benefits, which, as discussed above, depends upon that person’s household situation. Harding et al. (2006) find that most employees in Australia would retain at least half of any wage increase.
The extent to which higher minimum wages raise incomes also depends on whether there is any loss of employment as a result of the wage increase. As discussed above, research into the employment effects of changes in the level of minimum wages are diverse.
6.3 Minimum wages and a safety net
An important way in which minimum wages could be seen to promote social inclusion in Australia is in their role in providing a safety net. In an industrial relations sense, the safety net comprises national minimum wages together with the National Employment Standards and modern awards and provides employees with the protection of a threshold set of conditions and entitlements. As articulated by Buchanan and van Wanrooy ‘the defining feature of employment law is to establish rights and obligations to overcome the inequality of bargaining at the heart of most employment relationships’ (2009:3) and one of the ways it can reduce social disadvantage is in provision of a safety net.
Davidson discusses the role of minimum wages as setting the base for the broader wages structure (as opposed to providing a minimum living standard for low-paid workers) and highlights a community expectation that minimum wages should be set to allow workers ‘to work in dignity and to live decently’ (2008:8). As a result, Davidson argues, Australian minimum wages are high by international standards. This is shown in a comparison of 14 OECD countries with statutory minimum wages on standard indicators. For example, as at May 2008, Australia ranked fourth (after Luxembourg, France and the Netherlands) in terms of the value of its gross hourly minimum wage using purchasing power parity exchange rates (AFPC 2008:107).43
Leigh (2007:444) claims that across family types, below–minimum wage and minimum wage workers are over-represented in lone parent families, and under-represented in couple-only households. McGuinness, Freebairn and Mavromaras find single persons are more than twice as likely to be low paid (2007:19) and confirm the higher incidence of low pay among lone parents suggesting it is likely to ‘to be related, at least in part, to social security rules that give relatively more scope for such individuals to combine a low level of earnings with benefits’ (2007:5).
Research into characteristics of those more likely to be receiving the then minimum wage found that these groups included: those with a low level of education, young (21–30 years) full-time workers and older (over 60 years) part-time workers, migrants from non–English speaking backgrounds working full-time, those with lower occupational tenure and those working on a casual basis (McGuinness, Freebairn & Mavromaras 2007), part-time causal workers and those living in outer regional areas (Healy & Richardson 2006). In many cases these groups tend to experience more disadvantage on workforce participation indicators.
Australia’s welfare system provides a safety net through benefits both in and out of employment. Through a combination of minimum wages and benefits derived from the tax/transfer system, those at the lower end of the earnings distribution in Australia attain consistently higher relative net incomes than similar workers in most other developed countries with statutory minimum wages (OECD 2007a). This is a position, which Smyth argues should be strengthened through Australia’s distinct system which has evolved over the years (i.e. a hybrid of the welfare society and the welfare state) and new ‘welfare state models’ from Europe. He argues that since the minimum wage in Australia remains a key source of welfare, it would be imprudent to weaken it, unless it is replaced by a ‘very different social safety net with clearly articulated set of entitlements that each citizen will need for full economic and social participation’, along the European Union’s ‘social inclusion governance practices’ that would allow for guidelines to be established and combined with specific timetables for achieving the goals set (2008:660).
Rodgers & Rubery (2003) and Gregg (2000) argue that the establishment of a minimum wage also serves as a mechanism to combat discrimination and promote equality at work. Women, migrants and other groups who are discriminated against on the grounds of ethnicity, disability, age or health are disproportionately represented among the low paid.
Several research reports in recent years have noted relatively large numbers of adult employees receiving hourly wages that appeared to be below the Federal Minimum Wage (Austin et al. 2008:47; Healy & Richardson 2006:9; McGuinness, Freebairn & Mavromaras 2007:12). This has raised some questions about minimum wages and their role in providing a safety net. Factors that may have contributed to these research findings include non-compliance (Preston & Jefferson 2009), data error (reported or imputed), inadequate capturing of non-cash remuneration, long hours/unpaid overtime or forms of employment outside the coverage of statutory wage-setting.
Under the Fair Work Act 2009, the minimum wages objective requires FWA to establish and maintain a safety net of fair minimum wages, taking into account, amongst other factors, promoting ‘social inclusion through increased workforce participation’. This is also a requirement of the modern awards objective. As ‘social inclusion’ is not defined in the Act, and is a relatively new idea to Australia, this paper has explored a range of literature to further the understanding of the concept, particularly in a context of workforce participation.
From the literature reviewed in this paper, it would seem that not all employed persons are socially included, and not all jobless or unemployed persons are excluded, but generally the risk of not being socially included is greater for the jobless than for people who are in paid work. It is clear that workforce participation offers benefits and has the potential to enhance social inclusion. Through income earned from work, people are able to purchase goods and services to meet their material needs. Work enables individuals to build their human capital, leading to better work opportunities, although certain groups in the lower range of income distribution or casual work appear less likely to achieve this. Engagement in paid work can also lead to positive outcomes for an individual’s social and support networks and mental and/or physical health (with negative impacts noted particularly for those experiencing long-term unemployment).
However, the characteristics associated with an individual’s job may have the potential to inhibit the extent to which they are socially included. Underemployment; non-standard forms of work, without security of sufficient hours or tenure; longer working hours; and work intensification are factors that can be associated with a range of potential negative social, economic and health outcomes, thus putting those affected at greater risk of not being socially included. Some of these elements of work, for example casual employment, can have potentially inclusionary or exclusionary effects and these depend on the nature of the employment and the individual’s needs and responsibilities.
This paper outlined a number of workforce participation indicators that could be used to monitor social inclusion/exclusion in Australia. These indicators include labour force participation (including the participation of particular groups), the long-term unemployment rate, people living in jobless households, and income adequacy. In many cases, Australia currently compares favourably to other OECD countries on these measures. Over time, as experience with these indicators (particularly in application to panel data) grows, social and economic circumstances change and those working in the field gain deeper understanding, these indicators, as well as those covering other dimensions of social inclusion/exclusion, are likely to be reviewed and refined.
This paper has outlined some ways in which minimum wages may affect social inclusion. Minimum wages may play a role in providing the financial incentives for people to take up, or increase their hours in, jobs paid at minimum wages, or may enhance social inclusion through their role in providing a safety net. Minimum wage decisions may also have employment effects; however, these effects are not clear cut. The international and Australian literature has produced quite varied results, from showing negative effects or non-significant negative effects, to showing zero or positive employment effects. As detailed in the paper, Australia has higher minimum wages than many countries as well as having higher employment rates. This suggests that other labour market characteristics and institutional factors are important in this relationship. The connections between minimum wages and social inclusion represent an area for further consideration and research.
Bibliography
Abhayaratna J and Lattimore R (2006), Workforce Participation Rates – How does Australia Compare? Staff Working Paper, Productivity Commission, viewed 27 November 2009 <http://www.pc.gov.au/__data/assets/pdf_file/0008/60479/workforceparticipation.pdf>
Adams D (2009), A Social Inclusion Strategy for Tasmania, Department of Premier and Cabinet, Tasmania, viewed 16 December 2009 <http://www.dpac.tas.gov.au/__data/assets/pdf_file/0005/109616/Social_Inclusion_Strategy_Report.pdf>
Arulampalam W, Booth AL and Bryan ML (2002), Work-Related Training and the New National Minimum Wage in Britain, Discussion paper no. 595, Institute for the Study of Labor (IZA), viewed 5 January 2010 <http://www.iza.org/index_html?lang=en&mainframe=http%3A//www.iza.org/en/webcontent/personnel/photos/index_html%3Fkey%3D49&topSelect=personnel&subSelect=fellows>
Atkinson AB, Marlier E and Nolan B (2004), ‘Indicators and Targets for Social Inclusion in the European Union’, Journal of Common Market Studies, vol. 42, issue1, pp. 47-75
Atkinson T (1998), ‘Social Exclusion, Poverty and Unemployment’ in A B Atkinson & J Hills (eds), Exclusion, Employment and Opportunity, Centre for Analysis of Social Exclusion (CASE) paper 4, London School of Economics, London
Auer P (2009), The political economy of flexicurity, Seminar at the Socio-Legal Research Centre & The Centre for Work, Organisation and Wellbeing, Griffith University, Gold Coast Campus, 28 July 2009, viewed 8 January 2010 <http://www.griffith.edu.au/__data/assets/file/0006/155553/Is-Flexicurity-an-Answer.ppt>
Auer P, Berg J, and Coulibaly I (2005), ‘Is a stable workforce good for productivity?’ International Labour Review, vol. 144, issue 3, pp. 319–344
Auer P and Lansbury R (2009), Job ‘flexicurity’, Australia Broadcasting Corporation, viewed19 October 2009 <www.abc.net.au/unleashed/stories/S2664110.htm>
Austin J, Jefferson T, Preston A and Seymour A (2008), Gender pay differentials in low-paid employment, Research report no. 3/09, Curtin University of Technology, report commissioned by the Australian Fair Pay Commission, Melbourne
Australian Bureau of Statistics (2009a), Australian Labour Market Statistics, Nov 2009, cat. no. 6105.0, ABS, Canberra
Australian Bureau of Statistics (2009b), Australian Labour Market Statistics, April 2009, cat. no. 6105.0, ABS, Canberra
Australian Bureau of Statistics (2009c), Australian Social Trends, Dec 2009, cat. no. 4102.0, ABS, Canberra
Australian Bureau of Statistics (2009d), Australian Social Trends, June 2009, cat. no. 4102.0, ABS, Canberra
Australian Bureau of Statistics (2009e), Employment arrangements, retirement & superannuation Australia, June 2009, cat. no. 6361.0, ABS, Canberra
Australian Bureau of Statistics (2009f), Labour Force, Australia, Detailed – Electronic Delivery, Dec 2009, cat. no. 6291.0.55.001, ABS, Canberra
Australian Bureau of Statistics (2009g), Labour Force Experience, Feb 2009, cat. no. 6206.0, ABS, Canberra
Australian Bureau of Statistics (2008a), Employee Earnings, Benefits and Trade Union Membership Australia, Aug 2008, cat. no. 6310.0, ABS, Canberra
Australian Bureau of Statistics (2008b), Population Characteristics, Aboriginal and Torres Strait Islander Australians, Mar 2008, cat. no. 4713.0, ABS, Canberra
Australian Bureau of Statistics (2008c), Underemployed Workers Australia, Sep 2008, cat no. 6265.0, ABS, Canberra
Australian Bureau of Statistics (2007a), Australian Social Trends, cat. no. 4102.0, ABS, Canberra
ABS (2007b), Survey of Employee Earnings, Benefits and Trade Union Membership, cat no. 6310.0, ABS, Canberra
Australian Bureau of Statistics (2006a), Australian Labour Market Statistics, Jan 2006, cat. no. 6105, ABS, Canberra
Australian Bureau of Statistics (2006b), Australian Social Trends, cat. no. 4102.0, ABS, Canberra
Australian Bureau of Statistics (2006c), Forms of Employment, cat. no. 6359.0, ABS, Canberra
Australian Bureau of Statistics (2004), Disability, ageing and carers: summary of findings, cat. no. 4430.0, ABS, Canberra
Australian Bureau of Statistics (2003a), Australian Social Trends – Paid work: Longer working hours, cat. no. 4102.0, ABS, Canberra
Australian Bureau of Statistics (2003b), Employer Training Expenditure and Practices, cat no. 6362.0, ABS, Canberra
Australian Bureau of Statistics (2002), General Social Survey: Summary Results, cat. no. 4159.0, ABS, Canberra
Australian Bureau of Statistics (2001a), Household Expenditure Survey, Australia. Government Benefits, Taxes and Household Income 1998–99, cat. no. 6537.0, ABS, Canberra
Australian Bureau of Statistics (2001b), Population Characteristics: Aboriginal & Torres Straight Islander Australians, cat. no. 4713.0, ABS, Canberra
Australian Bureau of Statistics (2000), Australian Social Trends, cat. no. 4102.0, ABS, Canberra
Australian Bureau of Statistics (1999a), Australian Social Trends: Employment arrangements – decline of the standard working week, cat no. 4102.0, ABS, Canberra
Australian Bureau of Statistics (1999b), Labour Force Australia, Oct 1999, cat no. 6203.0, ABS, Canberra
Australian Bureau of Statistics (1999c), Time Use Survey, Australia, cat. no. 4151.0, ABS, Canberra
Australian Bureau of Statistics (1998), Australian Social Trends, cat. no. 4102.0, ABS, Canberra
Australian Bureau of Statistics (1997a), Australia’s Employment and Unemployment Patterns 1994–1996, cat. no. 6286.0, ABS, Canberra
Australian Bureau of Statistics (1997b), Australian Social Trends, cat no. 4102.0 ABS, Canberra
Australian Bureau of Statistics (1992), Australian Economic Indicators, cat. no. 1350.0, ABS, Canberra
Australian Capital Territory Government (2004), Building Our Community – The Canberra Social Plan, viewed 7 September 2009 <http://www.cmd.act.gov.au/__data/assets/pdf_file/0012/1236/Social_Plan.pdf>
Australian Centre for Industrial Relations Research and Training (1999), Australia at Work: Just Managing? Prentice Hall, Sydney
Australian Centre for Research in Employment and Work (2006), Characteristics of Employers of the Low Paid, Research report no. 2/06, report commissioned by the Australian Fair Pay Commission, Melbourne
Australian Council of Trade Unions (2003), The Future of Work, Working Hours and Work Intensification: Background Paper, ACTU Congress 2003, viewed 17 November 2009 <http://www.actu.asn.au/Images/Dynamic/attachments/146/ACTUCongress2003_Future_Of_Work_Working_Hours_And_Work_Intensification_Policy.pdf>
Australian Fair Pay Commission (2008a), Economic and Social Indicators – Monitoring Report, January to June 2008, Issue 02, Australian Fair Pay Commission, Melbourne
Australian Fair Pay Commission (2008b), Wage-setting Decision and Reasons for Decision, Australian Fair Pay Commission, Melbourne
Australian Fair Pay Commission (2006), Wage-setting Decision and Reasons for Decision, Australian Fair Pay Commission, Melbourne
Australian Government (2009a), The Australian Public Service social inclusion policy design and delivery toolkit, viewed 8 September 2009 <http://www.socialinclusion.gov.au/Documents/SIToolKit.pdf>
Australian Government (2009b), Social Inclusion in the Australian Government, viewed 13 August 2009 <http://www.socialinclusion.gov.au/AusGov/Pages/default.aspx>
Australian Government (2008), Social Inclusion Principles for Australia, viewed 22 September 2009 <http://www.socialinclusion.gov.au/SIAgenda/Principles/Documents/SIPrincilpes.pdf>
Australian Social Inclusion Board (2009), Social Inclusion: A compendium of social inclusion indicators – How is Australia faring? Social Inclusion Unit – Department of the Prime Minister and Cabinet, Canberra
Australian Social Inclusion Board (2010), Social Inclusion in Australia: How is Australia Faring? Social Inclusion Unit – Department of the Prime Minister and Cabinet, Canberra
Australian Human Rights and Equal Opportunity Commission (2005), Workability 2: Solutions – Final Report of the National Inquiry into Employment and Disability, Australian Human Rights and Equal Opportunity Commission, Sydney, viewed 28 January 2010 <http://www.hreoc.gov.au/disability_rights/employment_inquiry/final/toc.htm>
Australian Labor Party (2009), Julia Gillard – Member for Lalor, ALP, viewed 8 August 2009 <http://www.alp.org.au/people/gillard_julia.php>
Australian Labor Party (2007), An Australian Social Inclusion agenda, ALP, viewed 17 August 2009 <http://www.alp.org.au/download/now/071122_social_inclusion_xx.pdf>
Award review Taskforce (2006), Rationalisation of Wage and Classification Structures, Award Review Taskforce, Australian Government, Canberra
Baker M, Dwayne B and Shuchita S (1999), ‘The Highs and Lows of the Minimum Wage Effect: A Time-Series Cross-section Study of the Canadian Law’, Journal of Labor Economics, vol. 17, issue 2 pp. 318–350
Barbieri P, Paugman S and Russell H (2000), ‘Social capital and exits from unemployment’, in Gallie D and Paugman S (eds) Welfare Regimes and the Experience of Unemployment in Europe, Oxford University Press, Oxford
Barraket J (2005), Putting people in the picture?: the role of the arts in social inclusion, Social policy working paper no. 4, Brotherhood of St Laurence and The Centre for Public Policy, viewed 2 February 2010, <http://www.bsl.org.au/pdfs/barraket_arts_social_inclusion_1.pdf>
Bassanini A and Marianna P (2009), Looking inside the perpetual-motion machine: job and worker flows in OECD countries, Social employment and migration working papers no. 95, OECD, Paris
Baum S and Mitchell W (2009), ‘Geographic disadvantage: the demographics of social exclusion in Australia’, Paper for the University of Melbourne Social Inclusion Forum 25–26 June 2009, University of Melbourne, Melbourne
Baxter J (2009), Parental time with children: Do job characteristics make a difference? Research paper no. 44, Australian Institute of Family Studies, Melbourne, viewed 21 October 2009 <http://www.aifs.gov.au/institute/pubs/rp44/rp44.html>
Beck U (2000), The Brave New World of Work, Cambridge, Polity
Booth A and Bryan ML (2006), Training, Minimum Wages and Earnings Distribution, CEPR Discussion Paper 537, viewed 5 January 2010 <http://econrsss.anu.edu.au/pdf/DP537.pdf>
Bredgaard T, Larsen F, Madsen PK and Rasmussen S (2009), ‘Flexicurity and atypical employment in Denmark’, Paper delivered at the 15th World Congress International Industrial Relations Association in Sydney on the 25th of August 2009, Denmark: Centre for Labour Market Research (CARMA), University of Aalborg
Breunig R and Cobb-Clark D (2005), ‘Understanding the factors associated with financial stress in Australian households’, Australian Social Policy 2005, pp.13–64
Broom DH, D’Souza RM, Strazdins L, Butterworth P, Parslow R and Rodgers B (2006), ‘The lesser evil: bad jobs or unemployment? A survey of mid-aged Australians’. Social Science and Medicine, vol. 63, issue 3, pp. 575–586
Brotherhood of St Laurence (2004), Annual Report 2003/2004, viewed 2 February 2010 <http://www.bsl.org.au/pdfs/Annual_Report04.pdf>
Buchanan J and van Woonroy B (2009), ‘Employment law reform and social inclusion: If the social inclusion agenda was in the Fair Work Act, where would it be?’, Paper presented at the Social Inclusion Research Forum, University of Melbourne, June 25–26, 2009
Buckmaster L and Thomas M (2009), Social inclusion and social citizenship—towards a truly inclusive society, Research paper no. 02 2009–10, Parliamentary Library, Canberra, viewed 22 November 2009 <http://www.aph.gov.au/library/pubs/rp/2009-10/10rp08.htm>
Buddelmeyer H, Lee WS and Wooden M (2009), Low-paid Employment and Unemployment Dynamics in Australia, Melbourne Institute of Applied Economic and Social Research, The University of Melbourne, Paper presented to HILDA Survey Research Conference,16–17 July 2009, viewed 17 December 2009 <http://www.melbourneinstitute.com/conf/hildaconf2009/Papers/Session%205B/Buddelmeyer,%20Hielke_paper.pdf>
Buddelmeyer H and Wooden M (2008), Transitions from Casual Employment in Australia, Working paper no. 7/08, Melbourne Institute of Applied Economic and Social Research, The University of Melbourne
Buddelmeyer H and Verick S (2006), The Dynamics and Persistence of Income Poverty in Australia, Melbourne Institute of Applied Economic and Social Research, Melbourne, accessed on 4 February 2009 <http://www.melbourneinstitute.com/labour/inequality/dynam_pov_Hielke_Sher.pdf>
Burchardt T, Le Grand J and Piachaud D (2002), ‘Degrees of exclusion: developing a dynamic, multidimensional measure’ in Hills J, Le Grand J and Piachaud D (eds) Understanding Social Exclusion, pp. 30–43, Oxford University Press, London
Burchardt T, Le Grand J and Piachaud D (1999), Social Exclusion in Britain 1991–1995, Social Policy and Administration, vol. 33, issue 1, pp.227–244
Burgess J and Campbell I (1998a), ‘Casual Employment in Australia: Growth Characteristics, a Bridge or a Trap?’ The Economic and Labour Relations Review, vol. 9, issue 1, pp. 31–54
Burgess J and Campbell I (1998b), ‘The nature and dimensions of precarious employment in Australia’, Labour and Industry, vol. 8, issue 3, pp. 5–22
Burgess J and Mitchell WF (1998), ‘Unemployment, Human Rights and a Full Employment Policy in Australia’, Australian Journal of Human Rights, vol. 4 issue 2, pp. 76–94
Burkhauser RV, Couch KA and Wittenburg DC (2000), ‘A reassessment of the new economics of the minimum wage literature with monthly data from the current population survey’, Journal of Labor Economics, vol. 18, issue 4, pp. 653–680
Butterworth P (2003), The challenge of greater economic and social participation: Describing the disadvantage of lone mothers receiving income support, 8th Australian Institute of Family Studies Conference, Melbourne 12–14 February, viewed 21 August 2009 <http://www.aifs.gov.au/institute/afrc8/butterworth.pdf>
Cai L (2009), ‘Be wealthy to stay healthy: An analysis of older Australians using the HILDA Survey’, Journal of Sociology, vol. 45, issue 1, pp. 55–70
Cai L (2007), The Relationship between Health and Labour Force Participation: Evidence from a Panel Data Simultaneous Equation Model, Melbourne Institute working paper no. 1/07, Melbourne Institute of Applied Economic and Social Research, University of Melbourne
Cai L and Kalb G (2006), ‘Health status and labour force participation: evidence from Australia’, Health Economics, vol. 15, issue 3, pp. 241–261
Campbell I (2007), Long working hours in Australia: working time regulation and employment pressures, Working papers no. 2005-2, Centre for Applied Social Research, RMIT University
Campbell I and Peeters M (2008), ‘Low pay, compressed schedules and a high working intensity: a study of contract cleaners in Australia’, Australian Journal of Labour Economics, vol. 11, issue 1, pp. 27–46
Campbell I, Whitehouse G and Baxter J (2009), Australia: Casual employment, part-time employment and the resilience of the male-breadwinner model, Comparative Perspectives Database Working Paper Series, viewed 17 December 2009 <http://www.genderwork.ca/cpdworkingpapers/campbell-whitehouse-baxter.pdf>
Cass B (2007), ‘Social inclusion: A broader perspective’, Paper presented at workshop held by The Benevolent Society: Growing our Caring and Inclusive Community on 2 August 2007, Social Policy Research Centre, University of NSW
Carroll N and Poehl J (2007), Job mobility in Australia, HILDA Survey Research Conference, University of Melbourne, July 19–20, viewed 27 July 2009 <http://www.melbourneinstitute.com/hilda/conf/conf2007/HILDA%20Conf%20Papers%202007/All%20Papers/Carroll,%20Nicholas_final%20paper.pdf>
Castells M (1996), The Information Age: Economy, Society and Culture, Volume 1: The Rise of the Network Society, Cambridge (Massachusetts) & Oxford, Blackwell
Chant Link and Associates (2004a), A report on financial exclusion in Australia, ANZ Bank, viewed 17 July 2009 <http://www.anz.com/aus/aboutanz/community/programs/pdf/FinancialExclusion-FinalReport.pdf>
Chant Link and Associates (2004b), Volume 2: A Quantitative Report On Financial Exclusion, ANZ Bank, viewed 27 October 2009 <http://anz.com.au/about-us/corporate-responsibility/resources>
Charles N and James E (2003), ‘Gender and work orientations in conditions of job insecurity’, British Journal of Sociology, vol. 54, issue 2, pp. 239–257
Chartered Management Institute (2005), Tackling age discrimination in the workplace: Creating a new age for all, The Public Affairs Department, Chartered Management Institute, London, viewed 28 January 2010 <http://www.cipd.co.uk/NR/rdonlyres/9011EE0F-3DD0-4090-BE6C-65181FFDECBF/0/agedisc1005.pdf>
Davidson P (2008), Social inclusion, income support and the Australian labour market, Social Inclusion and Working Years Workshop Proceedings, Brotherhood of St Laurence, viewed 27 October 2009 <http://www.bsl.org.au/pdfs/Davidson_paper_10Nov08.pdf>
Daly M and Silver H (2008), ‘Social exclusion and social capital: A comparison and critique’, Theory and Society, vol. 37, pp. 537–566
Department for Children, Schools and Families (2009), Sure Start Children's Centres, DCSF, viewed 3 September 2009 <http://www.dcsf.gov.uk/everychildmatters/earlyyears/surestart/whatsurestartdoes>
Department of Education, Employment and Workplace Relations (2009), The origins, meaning, definition and economic implications of the concept social inclusion/exclusion, DEEWR, Canberra
Ministry of Foreign Affairs of Denmark (2009) Do you feel safe in a volatile labour market?, Ministry of Foreign Affairs of Denmark, viewed 17 February 2010 <http://www.denmark.dk/NR/rdonlyres/C598721F-8C7A-4408-9CA5-66DD79CC6CD5/0/FLEXICURITY.pdf>
Ministry of Foreign Affairs of Denmark (2008), Flexicurity – A Magic Formula, Ministry of Foreign Affairs of Denmark, viewed 27 October 2009 <http://www.denmark.dk/en/menu/About-Denmark-In-Brief/Denmark-An Overview/Flexicurity%e2%80%93AMagicFormula>
Department of Premier and Cabinet (Tasmania) (2009), Social Inclusion Unit, viewed 16 December 2009 <http://www.dpac.tas.gov.au/divisions/siu>
Department of Premier and Cabinet (Victoria) (2005), A Fairer Victoria, viewed 17 August 2009 <http://www.dpc.vic.gov.au/CA256D800027B102/Lookup/SocialPolicyActionPlan/$file/fairer%20vic.pdf>
Dickens R, Machin S and Manning A (1999), The effects of minimum wages on employment: Theory and evidence from Britain, Journal of Labor Economics, vol. 17, issue 1, pp. 1–21.
Dickens R, Riley R and Wilkinson D (2009), The employment and hours of work effects of the changing National Minimum Wage, March 2009, Report commissioned by the Low Pay Commission, viewed 16 February 2010 <http://www.lowpay.gov.uk/lowpay/research/pdf/NMW12.pdf>
Dickerson A (2007) Longer-term implications of the NMW: a re-examination of employer-provided training, Report presented to the Low Pay Commission, viewed 2 February 2010 <http://www.lowpay.gov.uk/lowpay/research/pdf/t0JK67V2.pdf>
Dockery M, Ong R, and Seymour R (2008), Life on the minimum wage: an empirical investigation, Research report no. 4b/08, Australian Fair Pay Commission, Melbourne
Dodds PS, Muhamad R and Watts DJ (2003), ‘An Experimental Study of Search in Global Social Networks’, Science, vol. 301, issue 5634, pp. 827–829
Doucouliagos H and Stanley TD (2009), ‘Publication Selection Bias in Minimum-Wage Research? A Meta-Regression Analysis’, British Journal of Industrial Relations, vol. 47, issue 2, pp. 406–428
Dunlop Y (2000), Occasional Paper: Labour Market Outcomes of Low Paid Adult Workers: An Application Using the Survey of Employment and Unemployment Patterns, cat. no. 6293.0.00.005, ABS, Canberra
Duxbury L and Higgins C (2003), Work-Life Conflict in Canada in the New Millenium Key Findings and Recommendations From The 2001 National Work–Life Conflict Study, viewed 17 November 2009 <http://www.phac-aspc.gc.ca/publicat/work-travail/report2/index-eng.php>
Eckersley R (2005), What is wellbeing, and what promotes it?, National Centre for Epidemiology and Population Health, Australian National University, viewed 21 September 2009 <http://www.wellbeingmanifesto.net/wellbeing.htm>
European Commission (2009), Social Inclusion, Employment, Social Affairs & Equal Opportunities, Brussels, viewed 2 September 2009 <http://ec.europa.eu/employment_social/spsi/poverty_social_exclusion_en.htm>
European Commission (2007), Towards Common Principles of Flexicurity: More and better jobs through flexibility and security, Office for Official Publications of the European Communities, Luxembourg
European Commission (2006), Joint report on social protection and social inclusion, European Commission, Brussels
Eurostat Task Force (1998), Recommendations on social exclusion and poverty statistics, 31st Meeting of the Statistical Programme Committee, Document CPS/98/31/2, viewed 22 July 2009 <http://www.ibge.gov.br/poverty/pdf/eurostat1.pdf>
Evans J and Repper J (2000), Employment, social inclusion and mental health, Journal of Psychiatric and Mental Health, vol. 7, pp.15–24
Fair Work Online (2009), Casual Employees, viewed 22 December 2009 <http://www.fairwork.gov.au/Pay-leave-and-conditions/Finding-the-right-pay/Pages/Casual-employees.aspx?role=employees>
Fear J and Denniss R (2009), Something for nothing: unpaid overtime in Australia, Policy brief no. 7 The Australian Institute, Canberra
Freeman R (1980), The exit-voice trade-off in the labour market: unionism, job tenure, quits and separations, Quarterly Journal of Economics, vol. 94, issue 4, pp. 643-674
Giddens A (1991), Modernity and Self-Identity: Self and Society in the Late Modern Age, Polity, Cambridge (UK)
Gillard J and Wong P (2007), An Australian social inclusion agenda, Australian Labor Party, viewed 22 July 2009 <http://www.alp.org.au/download/071122_social_inclusion.pdf>
Godin I and Kittell F (2004), ‘Differential economic stability and psychosocial stress at work: associations with psychosomatic complaints and absenteeism’, Social Science and Medicine, vol. 58, pp.1543–1553
Government of South Australia (2009), Social Inclusion Initiative, viewed 17 September 2009 <http://www.socialinclusion.sa.gov.au>
Gray M and Edwards B (2009), ‘Determinants of the Labour Force Status of Female Carers’, Australian Journal of Labour Economics, vol. 12, issue 1, pp. 5–20
Gray M, Edwards B, Hayes A and Baxter J (2009), ‘The impacts of recessions on families’, Family Matters, vol. 83, pp. 7–14
Green F (2004), ‘Why has work effort become more intense?’ Industrial Relations, vol. 43, issue 4, pp. 709–741
Gregg P (2000), The use of wage floors as policy tools, No. 31, 2000/II OECD Economic studies, Paris
Grzywacza JG and Dooley D (2003), ‘‘‘Good jobs’’ to ‘‘bad jobs’’: replicated evidence of an employment continuum from two large surveys’, Social Science and Medicine, vol. 56, pp. 1749–1760
Hahn M and Wilkins R (2008), A Multi-dimensional Approach to Investigation of Livings Standards of the Low-Paid: Income, Wealth, Financial Stress and Consumption, Melbourne Institute of Applied Economic and Social Research, Research report no. 4/09, report commissioned by the Australian Fair Pay Commission, Melbourne
Hall R, Bretherton T and Buchanan J (2005), ‘It’s not my problem’: the growth of nonstandard work and its impact on vocational education and training in Australia, NCVER, Adelaide, viewed 7 December 2009 <http://www.ncver.edu.au/research/proj/nr8009.pdf>
Harding A, Payne A, Vu QN and Percival R (2006), Interactions between Wages and the Tax-Transfer System Oct 2006, Report commissioned by the Australian Fair Pay Commission, Melbourne
Hayes A, Gray M and Edwards B (2008), Social Inclusion: Origins, concepts and key themes, Social Inclusion Unit, Department of Premier and Cabinet, viewed 22 September 2009 <http://www.socialinclusion.gov.au/Resources/Pages/Resources.aspx>
Healy J and Richardson S (2006), An updated Profile of the Minimum Wage Workforce in Australia Oct 2006, Research report no. 4/06, report commissioned by the Australian Fair Pay Commission, Melbourne
Henry JS and Jacobs JB (2007), ‘Ban the box to promote ex-offender employment’, Criminology & Public Policy, vol. 6, issues 4, pp. 755–761
Henry K (2009), Prevention: How do we build tomorrow’s capabilities today, Speech to Australian Research Alliance for Children and Youth (ARACY) Conference 3 September 2009, viewed 2 February 2010 <http://www.aracyconference.org.au/Thu%20KA4%201200%20Henry.pdf>
Henry K (2006), Australian Government submission: The impact on regional Australia, chapter 5, viewed 17 August 2009 <www.workplace.gov.au/NR/rdonlyres/47B10A15-53A7-4056-8B7A-603698DBB4E8/0/Chapter5_TheImpact_on_Regional_Australia.pdf>
Higgins C, Duxbury L and Johnson K (2004), Report 3 - Exploring the Link Between Work-Life Conflict and Demands on Canada's Health Care System from the 2001 National Work–Life Conflict Study, viewed 8 December 2009 <http://www.phac-aspc.gc.ca/publicat/work-travail/report3/pdfs/fvwklfrprt_e.pdf>
Howell N and Wilson T (2005), ‘Access to Consumer Credit: the Problem of Financial Exclusion in Australia and the Current Regulatory Framework’, Macquarie Law Journal, viewed 27 October 2009 <http://www.austlii.edu.au/au/journals/MqLJ/2005/7.html#Heading76>
Immervoll H (2007), Minimum wages, minimum labour costs and the tax treatment of low-wage employment, OECD Social, Employment and Migration Working Paper No. 46, OECD, Paris, viewed 22 January 2010 <http://www.oecd.org/els/workingpapers>
International Labour Organization (2007), Equality at work: Tackling the challenges, International Labour Conference, 96th Session 2007, Report I (B), International Labour Office, Geneva, viewed 20 January 2010 <http://www.ilo.org/wcmsp5/groups/public/---dgreports/---dcomm/---webdev/documents/publication/wcms_082607.pdf>
International Labour Organization (2006), C131 Minimum Wage Fixing Convention 1970, viewed 8 January 2010 <http://www.ilo.org/ilolex/cgi-lex/convde.pl?C131>
Jensen CS (2009), ‘Explaining Flexicurity – Employment elations in Denmark’, Paper delivered at the 15th World Congress International Industrial Relations Association in Sydney on 25 August 2009, Department of Sociology, University of Copenhagen
Jones A and Smyth P (1999), ‘Social exclusion: a new framework for social policy analysis?’, Just Policy, Vol. 17, pp.11–20
Karasek RA (1979), ‘Job demands, decision latitude, and mental strain: implications for job redesign’, Administrative Science Quarterly, vol. 24, pp. 285-308
Keller B and Seifert H (2009), ‘Flexicurity – Squaring the circle between flexibility and social security’, Paper delivered at the 15th World Congress International Industrial Relations Association in Sydney on 25 August 2009, University of Konstanz, Dusseldorf
Kennedy S, Stoney N and Vance L (2009), Labour force participation and the influence of educational attainment, Australian Treasury, viewed 29 September 2009 <http://www.treasury.gov.au/documents/1633/PDF/2_Labour_force.pdf>
Lam H and Harcourt M (2003), ‘The Use of Criminal Record in Employment Decisions: The Rights of Ex-offenders, Employers and the Public’, Journal of Business Ethics, vol. 47, issue 3, pp. 237–252
Landt J and Pech J (2000), Work and welfare in Australia: The changing role of income support, Welfare Review Team, Department of Family and Community Services, Canberra, viewed 11 November 2009 <http://www.aifs.gov.au/conferences/aifs7/landt.html>
Larsen TP (2009), ‘Flexicurity from the individual’s work/life balance perspective- Coping with the flaws in European child and elder care provision’, Paper presented for IIRA, Sydney 4th –7th of September 2009 Track 3: work family and the community, the paper can be accessed from the author by emailing: tpl@faos.dk
Levitas R, Pantazis C, Fahmy E, Gordon D, Lloyd E and Patsios D (January 2007), The Multi-dimensional analysis of social exclusion, Department of Sociology and School for Social Policy: Townsend Centre for the International Study of Poverty and Bristol Institute for Public Affairs, University of Bristol, Bristol
Leigh A (2007), ‘Does raising the minimum wage help the poor?’, The Economic Record, vol 83, issue 263, pp. 432–445
Leigh A (2003), ‘Employment effects of minimum wages: Evidence from a Quasi-Experiment’, Australian Economic Review, vol. 36, pp. 361–73
MacGregor L (2000), Mentoring: the Australian experience, Career Development International, vol. 5, issue 4/5, pp. 244–249
McClure P (2000), Participation support for a more equitable society, Department of Family and Community Services, Canberra
McGuinness S, Freebairn J and Mavromaras K (2007), Characteristics of Minimum Wage Employees, revised version July 2007, Research report no. 2/07, report commissioned by the Australian Fair Pay Commission, Melbourne
Machin S, Manning A. and Rahman L (2003), ‘Where the minimum wage bites hard: introduction of minimum wages to a low wage sector’, Journal of the European Economic Association, vol. 1, issue 1, pp.154–180
Madsen PK (2002), The Danish Model of ‘Flexicurity’ – A paradise with some Snakes, Department of Political Science, University of Copenhagen, Copenhagen, viewed 8 November 2010 <http://www.eurofound.europa.eu/working/employment/documents/madsen.pdf>
McClelland A (2005), From saving to empowering to including: Changing understandings of poverty at the Brotherhood of St Laurence, Social policy working paper no. 5, Brotherhood of St Laurence and The Centre for Public Policy, viewed 2 February 2010 <http://www.bsl.org.au/pdfs/McClelland_from_saving_to_empowering_to_including.pdf>
Melbourne Institute of Applied Economic and Social Research (2010), The Household, Income and Labour Dynamics in Australia (HILDA) Survey, University of Melbourne, accessed 2 February 2010 <http://www.melbourneinstitute.com/hilda>
Millward N, Stevens M, Smart D and Hawes WR (1992), Workplace Industrial Relations in Transition, Aldershot, Darmouth
Mitchell W and Welters R (2008), Does casual employment provide a ‘stepping stone’ to better work prospects? Working paper no. 08–11, Centre of Full Employment and Equity, The University of Newcastle
Mumford K and Smith NP (2000), Job tenure in Australia and Britain: Individual versus workplace effects, Department of Economics, University of York, York, the article can be obtained from K Mumford: kam9@york.ac.uk.
Naticchioni P and Panigo D (2004), Employment protection, job tenure and short-term mobility wage gains: a new explanation for the Italian case, viewed 19 November 2009 <http://www.cepremap.cnrs.fr/couv_orange/co0402.pdf>
National Institute of Labour Studies (2004), The Changing Labour Force Experience of New Migrants Inter-Wave Comparisons for Cohort 1 and 2 of the LSIA, Department of Immigration and Citizenship, viewed 5 November 2010 <http://www.immi.gov.au/media/publications/pdf/labour-forcev2.pdf>
NATSEM (2009), Healthy, wealthy and wise? The relationship between health, employment and earnings in Australia, July 2009, NATSEM income and Wealth Report, University of Canberra
New Zealand Ministry of Social Development (2001), The Social development approach, viewed 29 July 2009 <http://www.msd.govt.nz/about-msd-and-our-work/publications-resources/planning-strategy/social-development-approach/index.html>
Neumark D and Wascher W (2008), Minimum Wages, Massachusetts Institute of Technology, Massachusetts
Neumark D and Wascher W (2006), Minimum Wages and Employment: A review of evidence from the new minimum wage research, Working paper 12663, National Bureau of Economic Research, Cambridge, viewed 9 November 2009 <http://www.nber.org/papers/w12663>
Neumark D and Wascher W (2002), ‘Do minimum wages fight poverty?’, Economic Inquiry, vol. 40, issue 3, pp. 315–333
Neumark D (2001), ‘The employment effects of minimum wages: Evidence from a prespectified research design research design’, Industrial Relations, vol. 40, pp. 121–144
OECD (2010), Key Short-Term Economic Indicators: Harmonised Unemployment Rate, OECD, viewed 9 February 2010 <http://stats.oecd.org/index.aspx?DatasetCode=MEILABOUR>
OECD (2009), OECD Employment Outlook 2009, OECD, Paris
OECD (2008), OECD Employment Outlook 2008, OECD, Paris
OECD (2007a), Benefits and Wages 2007, OECD, Paris
OECD (2007b), OECD Social, employment and migration working papers, OECD, Paris
OECD (2004), Employment Outlook, OECD, Paris
OECD (1999), Benefit systems and work incentives, (1999 edition), OECD, Paris
Pech J, McNevin A and Nelms L (2009), Young People with Poor Labour Force Attachment: A Survey of Concepts, Data and Previous Research, Research report no. 11/09, Australian Fair Pay Commission, Melbourne.
Perkins D (2008), Social inclusion and the working years, Workshop Background Paper in Social Inclusion and Working Years Workshop Proceedings Nov. 2008, Brotherhood of St. Laurence, Melbourne
Perkins D (2006), ‘Improving employment participation for welfare recipients facing personal barriers’, Paper presented at the Social Policy Association Conference, University of Birmingham,
18–20 July 2006, Brotherhood of St. Laurence/The University of Melbourne, Melbourne
Perkins D and Scutella R (2008), ‘Improving Employment Retention and Advancement of Low Paid Workers’, Australian Journal of Labour Economics, vol. 11, issue 1, pp. 97–114
Pierson J (2002), Tackling Social Inclusion, Routledge, London
Preston A and Jefferson T (2009), ‘Labour Markets and Wages in 2008’, Journal of Industrial Relations, vol. 51, pp. 313– 330
Pocock B, Buchanan J and Campbell I (2004), Securing Quality Employment: Policy Options for Casual and Part-time Workers in Australia, Chifley Research Centre, Canberra
Pocock B, Skinner N and Ichii R (2009), Work, Life and Workplace Flexibility, Centre for Work and Life, University of South Australia, Adelaide
Pocock B, Skinner N and Williams P (2007), Work life and time: The Australian work life index 2007 (AWALI), Centre for Work and Life, Hawke Research Institute for Sustainable Societies, University of South Australia, Adelaide
Pocock B, Prosser R and Bridge K (2004), ‘Only A Casual . . . ’: How Casual Work affects Employees, Households and Communities in Australia, Labour Studies Report, University of Adelaide
Poell R, Van der Krogt FJ, Vermulst AA, Harris R and Simons M (2006), ‘Roles of informal workplace trainers in different organizational contexts: Empirical evidence from Australian companies’, Human Resource Development Quarterly, vol. 17 issue 2, pp.175–198
Pro Bono Australia (2008), Snapshot of Australia in 2020 – Get Ready for the Summit, viewed 29 October 2009 <http://www.probonoaustralia.com.au/news/detail.chtml?filename_num=201437>
Rice JM and Lesnard L (2008), Harmonising Leisure Time across Society and Family, Paper presented at The Australian Sociological Association 2–5 December 2008 Conference, University of Melbourne, Melbourne
Richardson S (2002), Low Wage Jobs and Pathways to Better Outcomes, Working paper 02, Commissioned by the New Zealand Treasury
Ridoutt L, Hummel K, Dutneall R and Selby-Smith C (2002), Factors influencing the implementation of training and learning in the workplace, viewed 31 August 2009 <http://www.ncver.edu.au/publications/828.html>
Room G (1995), ‘Poverty and Social Exclusion: The New European Agenda for Policy and Research’ in Room G (ed) Beyond the Threshold: The Measurement and Analysis of Social Exclusion, The Policy Press, London
Ross CE and Mirowsky J (1995), ‘Does Employment Affect Health?’, Journal of Health and Social Behavior, vol. 36, issue 3, pp.230–243
Rodgers J and Rubery J (2003), ‘Perspective: The minimum wage as a tool to combat discrimination and promote equality’, International Labour Review, vol. 142, issue 4, pp. 543–556
Sabia JJ (2009), ‘Identifying minimum wage effects: New Evidence from monthly CPS data’, Industrial Relations, vol. 48, issue 2, pp. 311- 327
Sabia JJ (2008), ‘The effects of minimum wage increases on retail employment and hours: new evidence from monthly CPS data’, Journal of Labor Research, vol. 30, pp.75– 97
Saunders P (2003), Can Social Exclusion Provide a New Framework for Measuring Poverty? SPRC Discussion paper no. 127, University of New South Wales, Sydney, viewed 17 August 2009 <http://www.sprc.unsw.edu.au/dp/DP127.pdf>
Saunders P, Naidoo Y and Griffiths M (2007), Towards new indicators of Disadvantage: Deprivation and social exclusion in Australia, viewed 7 September 2009 <http://www.sprc.unsw.edu.au/reports/ARC_Exclusion_FinalReport.pdf>
Schmidt SR and Svorny SV (1998), ‘Recent Trends in Job Security and Stability’, Journal of Labor Research, vol. XIX, issue 4, pp. 647–668
Scutella R, Wilkins R and Horn M (2009), Measuring Poverty and Social Exclusion in Australia: a proposed multidimensional framework for identifying socio-economic disadvantage, Working paper no. 4/09, Melbourne Institute of Applied Economic and Social Research, Melbourne
Scutella R, Wilkins R and Kostenko W (2009), Estimates of Poverty and Social Exclusion in Australia: A Multidimensional Approach, Working paper no. 26/09, Melbourne Institute of Applied Economic and Social Research, Melbourne.
Sen A (2000), Social exclusion: concept, application and scrutiny, Social development papers no.1, Office of Environment and Social Development, Asian Development Bank, Manila
Sen A (1999), Development as Freedom, Anchor Books, New York
Sennett R (1998), The Corrosion of Character: The Personal Consequences of Work in the New Capitalis, W.W. Norton & Company, New York & London
Sias PM and Cahill DJ (1998), ‘From Co-workers to Friends: The Development of Peer Friendships in the Workplace’, Western Journal of Communication, vol 62, issue 3, pp.273–299
Siegrist J (2000), ‘Place, social exchange and health: proposed sociological framework’, Social Science and Medicine vol. 51, pp.1283-1293
Siegrist J (1996), ‘Adverse health effects of high-effort/low-reward conditions’, Journal of Occupational Health Psychology, vol. 1, issue 1, pp. 27–41
Silver H (1994), ‘Social Exclusion and Social Solidarity: Three Paradigms’, International Labour Review, vol. 133, issue 5–6, pp. 531–578
Silver H (2009), ‘Understanding Social Inclusion: Lessons for Australia’, Paper presented at the Social Inclusion Research Forum 25–26 June 2009, University of Melbourne, Melbourne
Singell, L. D. and Terborg, J. R. (2006), Employment Effects of Two Northwest Minimum Wage Initiatives: Eating and Drinking and Hotel and Lodging, unpublished paper, University of Oregon.
Skinner N and Pocock B (2008), Work life and workplace culture: The Australian work life index 2008 (AWALI), Centre for Work and Life, Hawke Research Institute for Sustainable Societies, University of South Australia, Adelaide
Smith A, Oczkowski E, Noble C and Macklin R (2002), New management practices and enterprise training, NCVER, Adelaide
Smyth P (2008), ‘Closing the gap? The role of wage, welfare and industry policy in promoting social inclusion’, Journal of Industrial Relations, vol. 50, issue 4, pp. 647–663
Social Exclusion Unit (1997), Social Exclusion Unit: Purpose, work priorities and working methods, The Stationery Office, London
Stephens U (2009), Social Inclusion Policies, speech to the Annual Australian Workplace Conference, 7 August 2009, Sydney, viewed 18 August 2009 <http://www.ursulastephens.fahcsia.gov.au/Internet/ursulastephens.nsf/content/awc_07aug09.htm>
Stewart MB (2004), The impact of the introduction of the UK minimum wage on the employment probabilities of low-wage workers, Journal of the European Economic Association, vol. 2, issue 1, pp. 67–97
Stone W, Gray M and Hughes J (2003), Social capital at work: How family, friends and civic ties relate to labour market outcomes, Research paper no. 31, Australian Institute of Family Studies, Melbourne
Taylor J and Fraser A (2003), Eleven Plus: Life Chances and Family Income, Brotherhood of St Laurence, Melbourne
Tsakloglou P and Papadopoulos F (2002) ‘Aggregate level and determining factors of social exclusion in twelve European countries’, Journal of European Social Policy, vol. 12, issue 3, p. 211
UK National Statistics Office (2008), Trade Union membership 2008, viewed 17 November 2009 <http://stats.berr.gov.uk/uksa/tu/sa20090429.htm>
van Woonroy B, Jakubauskas M, Buchanan J, Wilson S and Scalmer S (2008), Australia at Work: Working Lives: Statistics and Stories, Workplace Research Centre, The University of Sydney, viewed 24 November 2009 <http://www.australiaatwork.org.au/assets/Australia%20at%20Work%20W2%20Working%20Lives.pdf>
van Woonroy B, Wright S, Buchanan J, Baldwin S and Wilson S (2009), Australia at Work: In a Changing World, Workplace Research Centre, The University of Sydney, viewed 30 November 2009 <www.australiaatwork.org.au/assets/Australia%20at%20work%20In%20a%20Changing%20World.pdf
VicHealth (2006), Workplace Stress in Victoria: Developing a Systems Approach Report – A summary report, May 2006, Victorian Health Promotion Foundation, Melbourne
VicHealth (2005), Social inclusion as a determinant of mental health and wellbeing, Research summary 2, Jan 2005, Mental Health & Wellbeing Unit, VicHealth, Melbourne
Vinson T (lead author) Australian Social Inclusion Board (2009), Social Inclusion: A compendium of social inclusion indicators – How is Australia faring? A compilation of comparative data undertaken by the Australian Social Inclusion Board to inform its advisory work, Australian Social Inclusion Unit – Department of the Prime Minister and Cabinet, Canberra
Vinson T (2009), The origins, meaning, definition and economic implications of the concept social inclusion/exclusion, Australian Government, Canberra, viewed 7 September 2009 <http://www.socialinclusion.gov.au/Documents/1Economicimplications.pdf>
Vinson T, Rawsthorne M and Cooper B (2007), Dropping off the edge: the distribution of disadvantage in Australia, Jesuit Social Services, Melbourne
Vinson T (2009), Markedly socially disadvantaged localities in Australia: their nature and possible remediation, Australian Government, Canberra, viewed 22 July 2009 <http://www.socialinclusion.gov.au/Documents/2DisadvantagedLocalities.pdf>
Visher CA, Winterfield L and Coggeshall MB (2005), ‘Ex-offender employment programs and recidivism: A meta-analysis’, Journal of Experimental Criminology, vol. 1, issue 3, pp. 295–315
Waterhouse C and Angley P (2005), Social exclusion among older people: a preliminary study from inner-city Melbourne, Brotherhood of St Laurence, Melbourne, viewed 2 February 2010 <http://www.bsl.org.au/pdfs/Social_exclusion_older_people.pdf>
Watson I (2004), Contented Casuals in Inferior Jobs? Reassessing Casual Employment in Australia, Working paper no 94, Australian Centre for Industrial Relations Research and Training, University of Sydney, viewed 25 August 2009 <http://www.wrc.org.au/working-papers.php>
Wellman B (1999), Networks in the Global Village: Life in Contemporary Communities, Westview Press, Boulder (Colorado)
Whelan CT, Layte R, Maitre B and Nolan B (2001), ‘Income, deprivation and economic strain: an analysis of the European Community Household Panel’, European Sociological Review, vol. 17, issue 4, pp. 357–72, in Peter Butterworth and Timothy Crosier (2005), Deriving a measure of financial hardship, Australian Social Policy 2005, pp. 1–12
Whelan CT (1993), ‘The role of social support in mediating the psychological consequences of economic stress’, Sociology of Health and Illness, vol. 15, issue 1, pp. 86–101, in Peter Butterworth and Timothy Crosier (2005), Deriving a measure of financial hardship, Australian Social Policy 2005, pp. 1–12
Whiteford P (2009), Social Inclusion: Family Joblessness in Australia, Social Inclusion Unit, Department of Premier and Cabinet, viewed 27 November 2009 <http://www.socialinclusion.gov.au/Resources/Pages/Resources.aspx>
Wilkin S and Pech J (2008), ‘Interactions with low wages: the Australian approach to in-work benefits’, Paper presented to the Thirteenth Conference on Labour, 11–12 December, Employment and Work (LEW 13), Victoria University of Wellington
Wilkins R, Warren D and Hahn M (2009), Families, Incomes and Jobs, Volume 4: A Statistical Report on Waves 1 to 6 of the HILDA Survey, Melbourne Institute of Applied Economic and Social Research, Melbourne
Wilkins R (2007), ‘The consequences of underemployment for the underemployed’, Journal of Industrial Relations, vol. 49, issue 2, pp. 247–76
Willis E (2005), ‘The hidden traps in multi-tasking: The experience of work intensification for personal service attendants in the healthcare sector’ in Baird M, Cooper R and Westcott M (eds) Proceedings of the 19th Conference of the Association of Industrial Relations Academics of Australia and New Zealand (AIRAANZ) Conference, Volume I: Refereed papers, viewed 17 November 2009 <http://airaanz.econ.usyd.edu.au/papers/Refereed%20papers.pdf>
Wooden M and Warren D (2003), The characteristics of casual and fixed-term employment: evidence from the HILDA Survey, Working paper 15/03, Melbourne Institute, Melbourne
Wooden M, Wilkins R and McGuinness S (2007), ‘Minimum Wages and the ‘Working Poor’’, Economic Papers, vol. 24, issue 4, pp. 295–307
Legislation
Fair Work Act 2009 (Cth)
The concept of ‘flexicurity’ first appeared in European academic discourse in the mid-1990s, addressing social and economic policies in general and employment policies in particular. Nowadays it is at the top of the European agenda and the European Commission (EC) has become its foremost proponent, urging European Union member states to adapt national employment policy strategies in line with the principles championed by the ‘flexicurity’ model (EC 2007; Keune & Jepsen 2007). The key elements of flexicurity are considered to constitute an integral part of the European Social Model, and to play a major role within the revised Lisbon Strategy for growth, jobs and competitiveness (Keller & Seifert 2009; Madsen 2002).
The EC defines flexicurity as ‘a comprehensive approach to labour market policy, which combines sufficient flexibility in contractual arrangements—to allow firms and employees to cope with change—with the provision of security for workers to stay in their jobs or be able to find a new one quickly, with the assurance of an adequate income in between jobs’ (EC 2007:10).
In Denmark, where flexicurity was first introduced in the mid-1990s, the model consists of government policies which provide more generous income support, effective retraining and life-long learning systems, along with highly developed labour laws, all of which aim to balance the need for workplaces to be flexible against the needs of workers for employment security (Auer & Lansbury 2009).
Since its introduction in Denmark in 1993, flexicurity has been credited for reducing unemployment in Denmark from a maximum of 10.2 per cent in 1993 to 5.2 per cent in 1999 (Madsen 2002). At the same time employment participation increased to 76.5 per cent, which is the highest among the European Union member states. As a result of these favourable outcomes, flexicurity has become a field of major interest to academics and policy makers in the European Union (EU), the International Labour Organization and the Organisation for Economic Co-operation and Development (OECD).
Researchers attribute the success of the Danish economic upswing to the adoption of a flexible liberal market economy with limited legal protection for workers against dismissal or a change in the extent of their working time, and social safety net policies built on relatively generous financial security for the unemployed and measures designed to encourage reintegration into the labour market (Keller & Seifert 2009). Madsen (2002) argues that, due to the non-restrictive employment protection legislation, which allows employers to hire and dismiss workers without considerable expense and with short notice, a large number of workers (as high as 25–30 per cent), are affected by unemployment every year, but that most of them quickly return to employment. Those who do not return to employment quickly are assisted by active labour market programmes before re-entering a job. At the same time, through its social security system and active labour market programmes, Denmark provides a generous safety net for its citizens (Ministry of Foreign Affairs of Denmark 2009; Madsen 2002).
On the other hand, one outcome of the large number of shifts between jobs is that some workers are being gradually excluded from the labour market (Madsen 2002). Another point of criticism, put forward by Keller and Seifert (2009) is that more emphasis is placed upon the flexibility component. They also argue that flexicurity refers mainly to patterns of standard employment and excludes existing types of atypical employment which include, among others, part-time employment, fixed-term contracts, casual employment, and agency work. Employees in these types of jobs are especially vulnerable—in view of this, flexicurity may be associated with increasing segmentation and the social consequences arising from this (Keller & Seifert 2009).
The effectiveness of flexicurity may depend on particular societal preconditions being present. With regard to the Danish labour market, Madsen (2002) and other researchers note the following features:
The relevance and suitability of ‘flexicurity’ to Australia has yet to be explored. If the above types of institutional and organisational conditions are not present, it may be difficult for other countries to achieve similar outcomes as Denmark by using a model of flexicurity.
Appendix 2—The federal government’s social inclusion approach
Social Inclusion Principles of Approach for Australia
Within the Australian context, the Australian Government (2008:2–4) provides some indication of how it envisages its holistic approach. It provides three aspirational principles: reducing disadvantage; increasing social, civil and economic participation; and a greater voice, combined with greater responsibility. In addition it provides eight principles of approach that include:
Focusing on long-term sustainable improvement. To do this, it will be important for the government to establish benchmarks; adopt formal quantified targets that are ambitious but attainable, measurable and time specific; focus on long-term policy goals; and integrate long-term social inclusion objectives in broader reform efforts, such as budgetary reform and reforms being pursued through the Council of Australian Governments.
Appendix 3—Dimensions of social exclusion
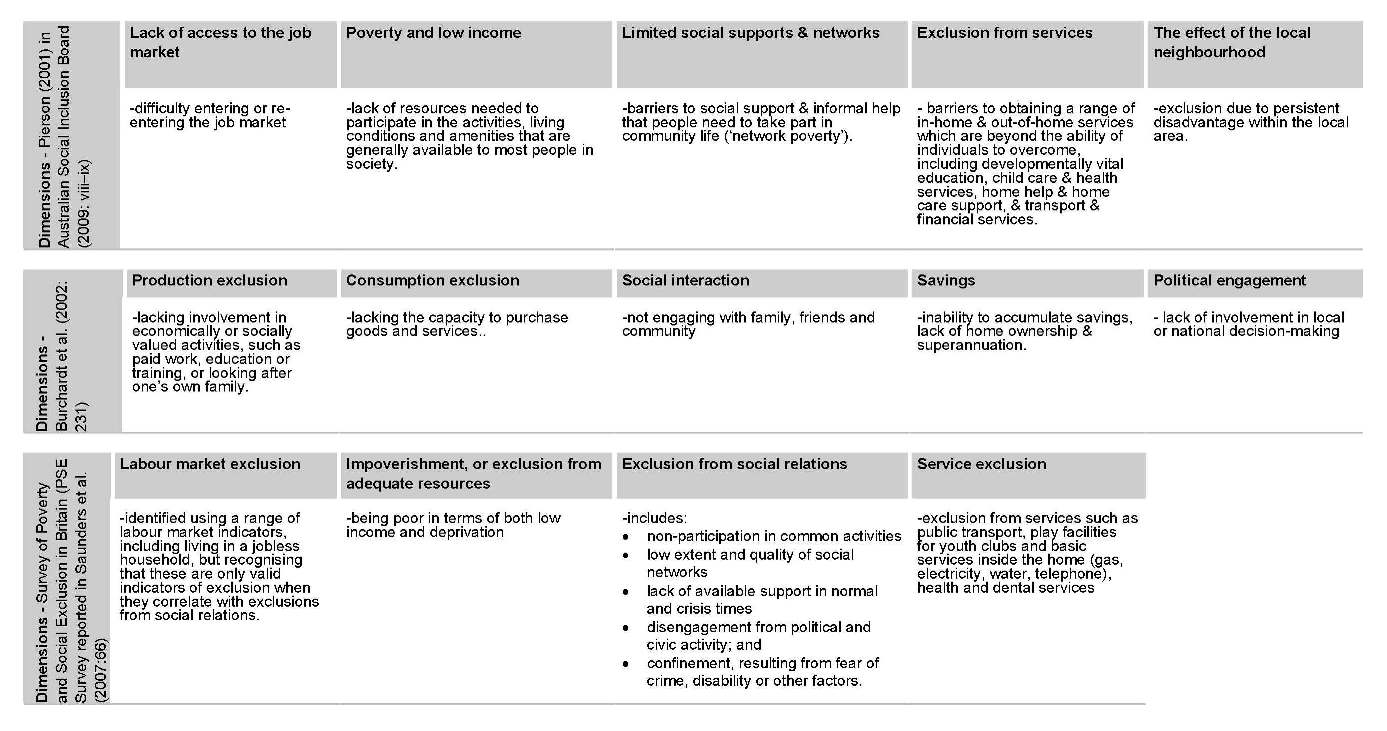
Appendix 4—International comparisons of job tenure
Job tenure is the length of time that workers remain in a given job. It is determined by a range of factors affecting the supply and demand of labour markets, including market conditions and institutional factors (e.g. employment protection legislation).
Figure 1.1—reproduced from a presentation by Auer (2009)—shows the average job tenure for a number of Organisation for Economic Co-operation and Development (OECD) countries. The average levels of tenure in most of these countries have broadly remained constant over time. Compared to other countries, Australia has the lowest average job tenure of all developed OECD countries (Auer 2009; Landt & Pech 2000; Mumford & Smith 2000). In 2008 average job tenure in Australia was four years, as opposed to 6.1 years in 1995 (Auer 2009:13; Mumford & Smith 2000:9; Pro Bono Australia 2008:1).44 Moreover, voluntary annual turnover is approaching 20 per cent, and one projection is that by 2020 average job tenure will reduce to around three years, with one in three workers employed on a casual basis (Pro Bono Australia 2008:1).
Mumford and Smith (2000) consider differences in individual job tenure between Australia and Britain. Based on the Australian Workplace Industrial Relations Survey 1995, they looked at a range of demographic, educational, job-related, occupational and work environment variables to try to explain Australia’s lower average job tenure.
Demographically, the Australian workforce is relatively young – in 2005, 71.3 per cent of persons aged 15 to 24 years participated in the workforce, compared with 65.9 per cent for Britain and the OECD average of 49.4 per cent (Abhayaratna & Lattimore 2006: 25 & 63, Table A3). Workplaces with higher numbers of young workers tend to have shorter tenure (Mumford & Smith 2000:10).
Other factors would tend to suggest that Australia should have similar or longer job tenure to Britain, including:
Madsen (2002) argues that the level of average job tenure ‘appears to be an inherent structural characteristic of the employment system of each country’ (2002:4), where employment protection legislation and labour market institutions (such as wage-setting structures, union power, unemployment insurance schemes, labour taxes, government mandated active labour market policies and retirement-related institutions) play an important role. In relatively open labour market systems, employees may have more opportunities to gain higher wages from increased job mobility, but may also face greater job uncertainty. Indeed, institutional differences, in particular the fact that firing costs in some countries are nearly proportional to job tenure, seem to be useful in explaining disparities between countries concerning job tenure (Naticchioni & Panigo 2004).
Figure 1: Average job tenure in years EU–15 for 192 and 2005
Source: Auer (2009).
Appendix 5—Selected studies of social exclusion: dimensions and indicators
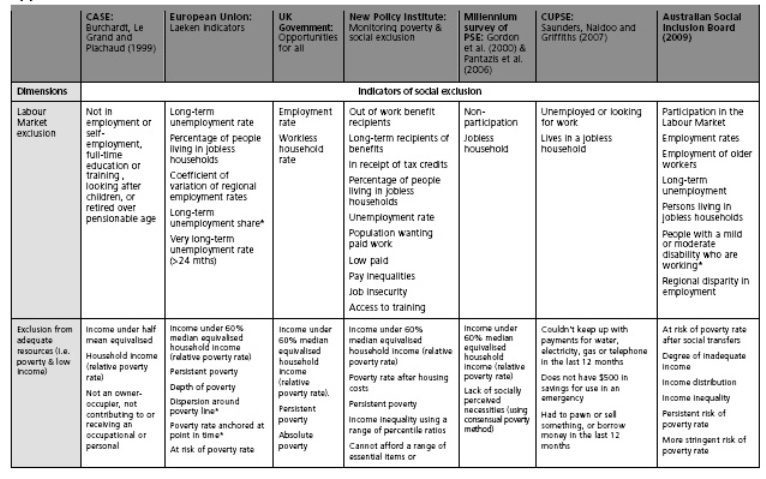
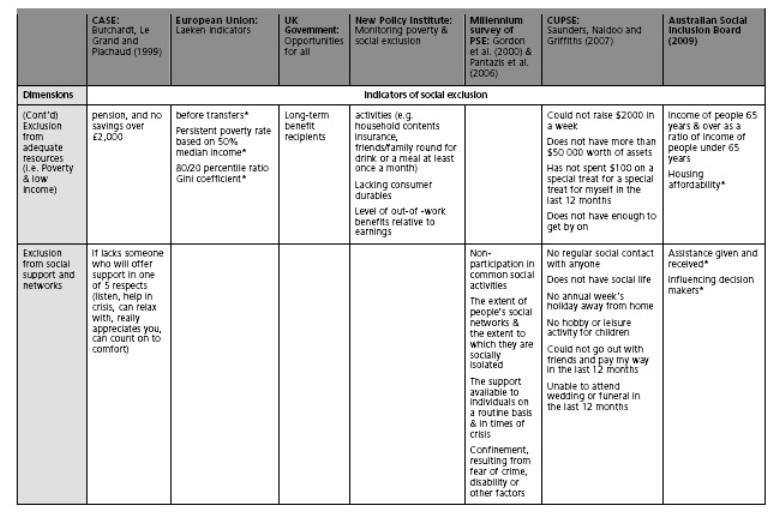
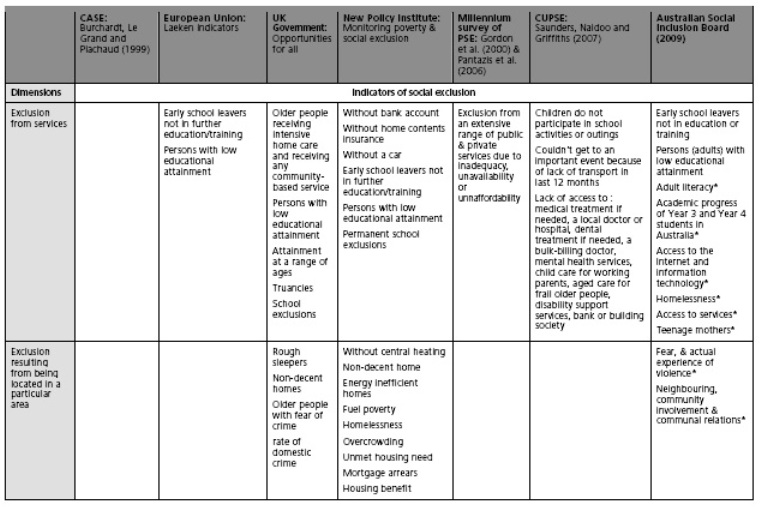
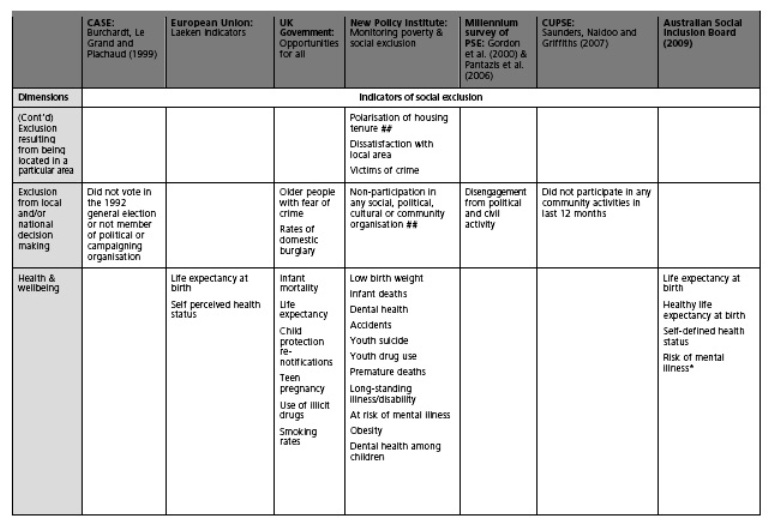
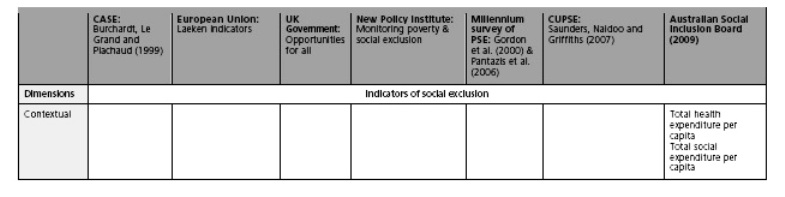
Notes: This Table has been largely reproduced from Scutella, Wilkins and Horn (2009).
* Secondary (or supplementary) indicators.
## These indicators have been categorised as measures of ‘social cohesion’ in Scutella, Wilkins and Horn (2009). Other indicators of social cohesion included teenage pregnancies, young people with a criminal record, and children in care
Appendix 6—Framework for measuring poverty and social exclusion in Australia (Scutella, Wilkins & Kostenko 2009)
Proposed framework for measuring poverty and social exclusion in Australia |
Indicators of poverty and social exclusion | |
Domain (or dimension) |
Component |
Indicator |
Employment |
Paid work and unpaid work |
Long-term unemployed Unemployed Unemployed & marginally attached Unemployed, marginally attached or underemployed In a jobless household |
Material resources |
Household income Household net worth Household consumption expenditure Financial hardship |
Income less than 60% of median income Household net worth less than 60% of median household net worth Consumption expenditure less than 60% of median consumption expenditure Three or more indicators of financial stress |
Education and skills |
Basic skills (literacy and numeracy) Educational attainment Lifelong learning |
Low literacy Low numeracy Poor English proficiency Low level of formal education Little or no work experience |
Health and disability |
General health Physical health Mental health Disability or long-term health condition |
Poor general health Poor physical health Poor mental health Has a long-term health condition or disability Household has a disabled child |
Social |
Social support Participation in common social activities Internet access |
Little social support Get together with friends/relatives less than once a month |
Community |
Neighbourhood quality Civic participation & voluntary activity / membership Access to health, utilities and financial services Access to transport |
Low neighbourhood quality Reported satisfaction with ’the neighbourhood in which you live’ low Reported satisfaction with ‘feeling part of local community’ low Not currently a member of a sporting, hobby or community-based club or association No voluntary activity in a typical activity |
Personal safety |
Victim of violent crime Victim of property crime Subjective safety |
Victim of physical violence in the last 12 months Victim of property crime in the last 12 months Low level satisfaction with ‘how safe you feel’ |
Appendix 7—Indicators of labour market inclusion/exclusion
Dimension |
Indicators of social inclusion/exclusion |
Definition of indicators and references |
Labour Market inclusion |
1. Participation in the Labour Market 2. Employment rate 3. Employment of older workers 4. Long-term unemployment rate 5. Persons living in jobless households 6. People with a mild or moderate disability who are working 7. Regional disparity in employment rates 8. Proportion of people who are low-paid |
|
1 The use of the concept ‘social exclusion’ preceded that of ‘social inclusion’, and the literature around the term is more developed. Therefore, the discussion in section 1.1 focuses primarily on social exclusion.
2 The term is attributed to Rene Lenoir, then Secretary of State for Social Action.
3 The Brotherhood of St Laurence Annual Report 2003–2004 details a range of research projects using the concepts of social inclusion or social exclusion as a conceptual framework (Brotherhood of St Laurence 2004). Some examples of early publications using or exploring the concept of social exclusion include: Barraket 2005; McLelland 2005; Taylor & Fraser 2003; Waterhouse & Angley 2005.
4 The previous federal government made reference to an increased risk of ‘financial hardship and social exclusion’ arising from long-term receipt of income support in relation to welfare reform in 2002 (Saunders 2003).
5 Ken Henry, Secretary of the Treasur`y, has spoken publicly several times of the capabilities approach, a recent example being in the context of the ‘Henry Tax Review’ (see, for example, Henry 2009).
6 In 2006 the SEU transformed into the Social Exclusion Task Force within the UK Government Cabinet office (Cabinet Office 2010).
7 See Appendix 2 for further details.
8 Currently there is an absence of established theoretical frameworks of social inclusion in the literature.
9 Frameworks that include this dimension include that proposed by Scutella, Wilkins and Kostenko (2009), see Appendix 6.
10 It is not a simple proposition that gaining employment or increasing income automatically ensures, for example, improvement in the standard of diet or housing or access to financial products and services. Or that improving these outcomes for those who are unemployed could lead to gaining employment. Many other socioeconomic, institutional and labour market factors (such as labour demand) are important in determining these and other outcomes.
11 section 3 of this report referred to ‘exclusion from adequate resources’ and ‘exclusion from services’ as two separate dimensions of social exclusion. For the purpose of this section we refer to services that the individual is able to acquire through the income obtained from work, rather than those services (such as public transport) that are primarily beyond the individual’s control.
12 The HILDA Survey is a household-based panel study which began in 2001. The wave 1 panel consisted of 7682 households and 19 914 individuals. Interviews are conducted annually with all adult members of the household. The HILDA Survey was initiated, and is funded, by the Australian Government through the Department of Families, Housing, Community Services and Indigenous Affairs. Melbourne Institute of Applied Economic and Social Research, University of Melbourne holds responsibility for the design and management of the survey (Melbourne Institute 2010).
13 Of the two studies cited below, Hahn and Wilkins (2008) utilised the longitudinal capacity of the HILDA Survey and used all available waves at the time (2001–06 HILDA data) for their analysis. Dockery, Ong and Seymour (2008) limited their sample to the only wave available at that time (2006 HILDA data) in which the FMW was in effect.
14 The OECD Household Equivalence Scales are used to adjust income to recognise the economies of consumption enjoyed by people who live with others. They are designed to enable a valid comparison of resources, needs or living standards of individuals living in households of varying sizes.
15 Dunlop (2000) used a threshold indexed to average weekly total earnings for each reference year, which, for example in 1997 represented 113 per cent of the then hourly minimum wage.
16 This study analysed a national random sample of 1500 Australians using a network and typology approach to social capital to investigate the relative impact of trust, bonding, bridging and linking relationships upon labour force status and successful job search method (Stone, Gray & Hughes 2003).
17 Gray et al. (2009) raise a range of additional effects (beyond those related to health) associated with long-term unemployment, including impacts on individuals’ earnings (cited earlier) and related impacts on educational and social outcomes for children in long-term jobless households.
18 These data are based on self-reported responses from the 2007 Survey of Employment Arrangements, Retirement and Superannuation (ABS 2009d). It is, therefore, possible that some respondents who received a casual loading may not have been aware of it.
19 Under modern awards, the standard minimum casual loading is 25 per cent (Fair Work Online 2009).
20 The casual loading was originally established to create a disincentive to casual employment and to compensate casual workers for some of their lost conditions, such as loss of annual leave, sick leave, and/or for casual work being intermittent and impermanent. For example, when the annual leave standard for permanent employees increased from three to four weeks, most casual loadings increased from 15 to 20 percent. By the late 1990s, the majority of awards included a loading of 20 per cent, although for about one-fifth of awards it stood at 25 percent or more (Pocock, Prosser & Bridge 2004:37–42). The Award Review Taskforce considered casual loading arrangements both generally and on an industry-specific basis. It found that ‘not only do widespread disparities exist within and across industry sectors, but there are also widespread variations in the basis for these loadings’. The Taskforce examined casual loadings in a sample of 40 Retail and 35 Accommodation and food services pre-reform awards. ‘The variation in casual loadings ranged from 12.5 percent to 50 percent’ (Award Review Taskforce 2006:41–44).
21 Pocock, Prosser and Bridge (2004) report on the findings of qualitative interviews with 55 casual workers. These casual workers were randomly selected from a pool that had responded to advertisements for their participation or were recruited through a number of unions.
22 It is worth noting that part-time arrangements do not have to be casual, and it could be argued that it would be more appropriate to engage long-term, regular casuals on a permanent part-time basis. However, employers may avoid this option because of the additional costs involved in employing permanent staff. In addition, some employees may prefer casual employment because the associated loading boosts their otherwise low pay.
23 The AWALI survey results are based on computer-assisted telephone interviews of a national stratified random sample of 1435 Australians (in the 2007 wave).
24 These findings are based on the AWALI survey which measures perceptions of work–life interaction focusing on: (i) the frequency that work interferes with responsibilities or activities outside work; (ii) the frequency that work restricts time with family and friends; (iii) the frequency that work affects workers’ ability to develop or maintain connections and friendships in their local community; (iv) satisfaction with overall work–life ‘balance’; and v) frequency of feeling rushed or pressed for time. AWALI 2008 brings together these five measures of work–life interaction to arrive at an overall work–life index that is scaled from 0 (best work–life interaction) to 100 (worst work–life interaction) (Skinner & Pocock 2008:14–15). [continued reference from footnote 24]
25 The authors’ sample is from the ABS Time Use Survey 1997, and is restricted to adults with spouses (ABS 1999c).
26 Given Australia’s comparatively high rate of part-time employment among OECD countries— Australia has the third highest rate of part-time employment as a proportion of total employment (OECD 2009:268)—its position is close to the middle rankings of average hours worked by all workers (OECD 2009:269).
27 The Australia at Work survey conducted by the Workplace Research Centre, University of Sydney, involved around 6800 participants in 2009 including 6300 ongoing respondents from 2006 to 2009.
28 The authors report on data from a range of sources including qualitative interviews with 32 cleaners and stakeholders.
29 VicHealth (2006) commissioned a University of Melbourne team to review national and international job stress research and to undertake a stakeholder interview study involving 41 representatives. The report also details results from a population-based profiling of job stress exposure through a survey of 1101 working Victorians. The researchers used measures of job stress from Karasek’s (1979) demand/control model and Siegrist’s (1996) effort/reward imbalance model, which have been replicated in numerous studies.
30 An ‘optimal’ employment arrangement is characterised by high levels of decision latitude and low to moderate levels of job demand (Grzywacza & Dooley 2003:1750).
31 ‘Barely adequate’ jobs are characterised as those that are better than inadequate jobs, but do not provide basic levels of economic or non-income resources or psychological attributes (Grzywacza & Dooley 2003:1752)
32 The OECD harmonised unemployment rate for Australia increased from 4.2 to 5.6 percent between 2008 and 2009. While other countries and regions have sustained larger percentage point increases from a higher base over this period for example, the US rate increased from 5.8 to 9.3 percent and for the European Union 7.0 to 8.9 per cent (OECD 2010).
33 These rates include those who are employed through the Community Development Employment Program . The difference between Indigenous and non–Indigenous people is much higher if this group is excluded.
34 The age structure of migrants differs from the age structure of those born in Australia. In order to accurately compare these groups it is important to remove the effects of these different age structures.
35 The growth in the employment rate of single parents since 2001 (9.3 percentage points), exceeds that of partnered parents (3.2 percentage points). The employment rate of single parents was 54 per cent in 2005 (ABS 2009f), indicating that the upward trend in employment for single parents has continued since the introduction of Welfare to Work changes in 2006.
36 Long-term unemployment is defined as duration of unemployment of 12 months or more (ABS 2006a:26).
37 A jobless household is one in which no usual resident of the household aged 15 years or over is currently employed (ABS 2002:78).
38 According to Buddelmeyer and Verick (2006:4), in Australia, relative poverty is defined according to some threshold in the income distribution. There are two sets of equivalence scales that are widely used. The first, named the Henderson Poverty line, ‘adjusts the net income of families according to numbers of family members, the differing costs of family members depending on their age and engagement in employment, and, for the family as a whole, their housing costs’ (ABS 1998:126). The second set uses the definition based on the 50 per cent of the Median Equivalent Income threshold. These scales (second), devised by the OECD, accommodate differences only in the numbers of adults and children in families (ABS 1998:126; Buddelmeyer & Verick 2006:4). [continued reference from footnote 38]
39 The ABS defines disability as any limitation, restriction or impairment, which has lasted, or is likely to last, for at least six months and restricts everyday activities (ABS 2004:3).
40 Differences in labour force participation at a local level may be indicative of social inclusion/social exclusion for particular geographical areas. However, other factors beyond the proximity to employment and individual attributes contribute to labour market outcomes within an area, for example neighbourhood demographic characteristics and informal job networks (Vinson 2009).
41 Figures have been updated using the same methodology as Pech, McNevin and Nelms (2009). Source: ABS, Labour Force, Australia, Detailed – Electronic Delivery, October 2009, cat. no. 6291.0.55.001, ABS, Canberra, Tables 3b and 3c.
42 Estimates of the negative effects have tended to be larger for teenagers/young people than for adults.
43 In 2005, Australia ranked fourth (after Luxembourg, the United Kingdom and the Netherlands) in terms of the after-tax value of the hourly minimum wage for a full-time worker (Immervoll 2007:13, Figure 1(b)). Even after accounting for Australia’s relatively low non-wage labour costs, such as mandatory employer social security contributions (e.g. health insurance) and payroll taxes, Australia still ranked highly in terms of the total labour costs for employers of hiring full-time minimum wage workers in 2005 (Immervoll 2007:15, Figure 2(a)).
44 Note that while the OECD provides a broadly accurate perspective on job tenure and other labour market data, differences in job tenure may reflect variations in statistical practices across countries.