receiving minimum rates of pay
Tom Bolton and Troy Wheatley, Minimum Wages and Research Branch—Fair Work Australia February 2010
The contents of this paper are the responsibility of the authors and the research has been conducted without the involvement of members of the Minimum Wage Panel of Fair Work Australia.
ISBN 978-0-9807678-0-3
© Commonwealth of Australia 2010
This work is copyright. Apart from any use as permitted under the Copyright Act 1968, no part may be reproduced by any process without prior written permission from the Commonwealth. Requests and inquiries concerning reproduction and rights should be addressed to the Commonwealth Copyright Administration, Attorney General’s Department, Robert Garran Offices, National Circuit, Barton ACT 2600 or posted at http://www.ag.gov.au/cca.
All research undertaken by or commissioned by Fair Work Australia for the Annual Wage Review 2009-10 has been agreed by the Research Group. The Research Group comprises a Chair from the Minimum Wage and Research Branch of Fair Work Australia, and representatives nominated by:
This paper, “Earnings of employees who are reliant on minimum rates of pay”, is the work of Tom Bolton and Troy Wheatley of the Minimum Wages and Research Branch, Fair Work Australia.
Tom Bolton and Troy Wheatley are grateful for comments provided by Dr Josh Healy, National Institute of Labour Studies, Flinders University. The authors would also like to acknowledge Kelvin Yuen for his assistance.
A draft of this paper was workshopped with the Research Group prior to finalisation. Tom Bolton and Troy Wheatley would also like to thank the Research Group for its comments.
The contents of this research paper, however, remain the responsibility of the authors, Tom Bolton and Troy Wheatley.
Contents
2 Occupational status of employees reliant on minimum rates of pay 19
2.1 Major occupational group (ANZSCO 1-digit level) 19
2.2 Sub-major and minor occupational groups (ANZSCO 2-digit and 3-digit levels) 19
List of Tables
Table 1: Composition of employees receiving minimum rates of pay by adult/junior rates of pay, and receiving/not receiving a casual loading 8
Table 4: Minimum wage reliance by occupation group (ANZSCO 1-digit, 2-digit, and 3-digit levels) 23
Figure 2: Distribution of hourly ordinary-time cash earnings for adult permanent employees 12
Figure 6: Distribution of hourly ordinary-time cash earnings for junior employees receiving minimum rates of pay, with earnings of casual employees discounted for a 25 per cent casual loading 17
ABS |
Australian Bureau of Statistics |
ANZSIC |
Australian and New Zealand Standard Industrial Classification |
ANZSCO |
Australian and New Zealand Standard Classification of Occupations |
CURF |
Confidentialised Unit Record File |
EEH |
Employee Earnings and Hours |
FMW |
Federal Minimum Wage |
HILDA |
Household Income and Labour Dynamics in Australia |
Pay Scale |
Pay and Classification Scale |
Executive Summary
This report provides detailed information on the earnings and occupational status of employees who are receiving minimum rates of pay, using data from the May 2006 Australian Bureau of Statistics’ (ABS) Employee Earnings and Hours (EEH) survey. The EEH survey is a large survey that collects information on the method by which employees’ pay is set, and therefore can be used to identify employees who are receiving the rate of pay specified in the relevant award or transitional Pay and Classification Scale (Pay Scale).
The report describes the distributions of hourly ordinary-time earnings for various types of employees receiving minimum rates of pay, using 25 cent intervals. It finds that, in May 2006, for adult employees receiving minimum rates of pay the ‘peak’ of the distribution was around what was then the value of the basic tradesperson’s (C10) rate rather than what was then the value of the Federal Minimum Wage (C14). Most junior employees on minimum rates of pay received less than $13 per hour, with the ‘peak’ of the distribution being around $6-8 per hour.
Employees receiving minimum rates of pay are most likely to be employed as Community and personal service workers, Sales workers, and Labourers. The report shows that, at more detailed levels of occupational status, the occupational groups with particularly high percentages of employees receiving minimum rates of pay include:
This report provides detailed information on the earnings of employees who are receiving minimum rates of pay, using data from the Australian Bureau of Statistics’ (ABS) Employee Earnings and Hours (EEH) survey.1
The EEH survey is a large survey that collects information on the earnings and hours of employees, as well as various characteristics of those employees (such as sex, age, occupation, etc.), and significantly, the method by which their pay is set. The information from the survey can be used to identify employees who are receiving minimum rates of pay – i.e. the rate of pay specified in the relevant award or transitional Pay and Classification Scale (Pay Scale). Data from the survey for individual employees is available from the Confidentialised Unit Record File (CURF).
This report uses the CURF for the May 2006 EEH survey. Although there has been a subsequent survey, conducted in August 2008, there is currently no CURF available for this survey. The May 2006 survey found that 19.0 per cent of (non-farm) employees were receiving minimum rates of pay (this percentage fell to 16.5 per cent in the August 2008 survey).
Section 1 describes the distribution of earnings of employees reliant on minimum rates of pay using the individual employee data from the EEH CURF. This part also discusses various issues with the EEH survey that influence the resultant earnings distribution. Section 2 uses the detailed occupational data from the EEH CURF to examine the occupational status of employees reliant on minimum rates of pay.
This section describes the distribution of earnings for various types of employees who receive minimum rates of pay.
The EEH survey is a large survey of employers that collects information on the earnings and hours paid for of their employees.
Data on employees are collected through a two-stage sample selection approach. In the first stage a sample of approximately 9000 employer units are selected from the ABS Business Register. In the second stage the selected employers are asked to select a random sample of employees from their payrolls (using instructions provided by the ABS). For the May 2006 survey, data for approximately 58 000 employees contributed to the results.
The measures of earnings available from the EEH CURF include: weekly ordinary time cash earnings, weekly overtime cash earnings, and weekly total cash earnings (which is the sum of the other two measures of earnings).
Under the ABS’ framework for measures of employee remuneration, the term ‘cash earnings’ refers to regular wages and salaries in cash. This includes not only ordinary time and overtime payments, but also taxable allowances, commissions and tips, regular bonuses and amounts salary sacrificed.
There are no measures of hourly rates of pay available from the EEH CURF; however measures of hourly cash earnings can be generated by dividing weekly cash earnings measures by the relevant measures of hours paid for. Because of the way earnings are measured by the ABS – that is, it includes payments such as penalty payments, shift allowances, and regular bonuses – none of these derived hourly earnings measures will necessarily coincide with basic hourly rates of pay. Of these derived hourly measures, a measure of hourly ordinary time cash earnings – derived by dividing weekly ordinary time cash earnings by weekly ordinary time hours paid for – would most closely approximate an employee’s basic hourly rate of pay.2
1.1.2 Earnings of casual employees
Another complication with using the earnings measures from the EEH survey is the presence of loadings for casual employees. Many people employed on a casual basis receive a loading on their basic rate of pay to compensate them for the lack of entitlements such as annual and sick leave.3 This has the effect of raising their measured earnings, so that, for example, an employee who received the Federal Minimum Wage (FMW) as their basic periodic rate of pay but also receives a 25 per cent casual loading would be found to earn 125 per cent of the then FMW.
The EEH CURF flags which employees receive a casual loading, but does not show the value of these loadings. As agreed with Research Group members the analysis in this article assumes that, in each case, the casual loading received was 25 per cent, which is the standard minimum casual loading in Modern Awards. The Award Review Taskforce found that, in 2006, casual loadings varied from 0-14 per cent to 100-149 per cent, with 20 per cent being the most common award loading at that time.4
The EEH survey defines an employee as having their pay set by an award or Pay Scale only if they are paid at the rate of pay specified in the award or Pay Scale, and are not paid more than that rate of pay. Any employee who earns more than the rate of pay specified in the award or Pay Scale will not be classified in this group.
The EEH survey defines junior employees as employees who are under 21 years of age and are not paid the full adult rate for their occupation. As of May 2006 48 per cent of junior employees were classified as having their pay set by an award or Pay Scale only.5
The survey data do not show the ratio between a junior employee’s rate of pay and the full adult rate, meaning that it is not possible to reconcile the pay distribution for juniors with the adult pay classifications.
Some employees, including those primarily engaged in Agriculture, forestry and fishing, and those employed within private households, are not within the scope of the survey. Therefore, these employees have not contributed to either the earnings data or the occupational data used in this report.
McGuinness, Freebairn and Mavromaras point out that ‘cash in hand’ employment will not be picked up by payroll data.6 They compared estimates from the EEH survey data and the Household Income and Labour Dynamics in Australia (HILDA) survey data on the likely coverage of the FMW. These estimates were based purely on the amount that employees earn, and not on the method by which their pay was set, which is not asked for in the HILDA survey. Their estimate of the coverage of the FMW was considerably higher using the HILDA data, which they attributed primarily to the inability of the EEH survey to capture ‘cash in hand’ employment.
As with any data set there are limitations with regard to the level of detail of information that can be derived from the variables. For example, we considered comparing the earnings distributions for employees who are reliant on minimum rates of pay with employees who are not reliant on minimum rates of pay, cross-classified by industry at the 1-digit ANZSIC level and by occupation at the 1-digit ANZSCO level (which are the broadest levels available for industry and occupation). However, the ABS informed us that the data would not be of sufficient quality to be released.
1.2 Earnings distributions of employees who are reliant on minimum rates of pay
Given the fundamental differences (discussed above) in how earnings are set for different types of employees, the paper looks separately at the earnings distributions of the following groups:
As of May 2006, 47 per cent of employees receiving minimum rates of pay were in the first group, 37 per cent were in the second group, and 16 per cent were in the third group (Table 1).
Table 1: Composition of employees receiving minimum rates of pay by adult/junior rates of pay, and receiving/not receiving a casual loading
|
Number of observations in CURF |
Number of employees in category as percentage of all employees |
Number of employees in category as percentage of employees receiving minimum rates of pay |
Adult employees not receiving a casual loading |
4506 |
9.0 |
47.3 |
Adult employees receiving a casual loading |
3085 |
7.1 |
37.2 |
Junior employees not receiving a casual loading |
553 |
1.2 |
6.3 |
Junior employees receiving a casual loading |
662 |
1.8 |
9.3 |
Total |
8806 |
19.0 |
100.0 |
Source: ABS, Microdata: Employee Earnings and Hours, Expanded CURF, Australia, Catalogue No. 6306.0.55.001, May 2006.
Note: Figures in the final two columns have been adjusted using survey weights.
1.2.1 Adult employees who are reliant on minimum rates of pay7
1.2.1.1 Permanent employees
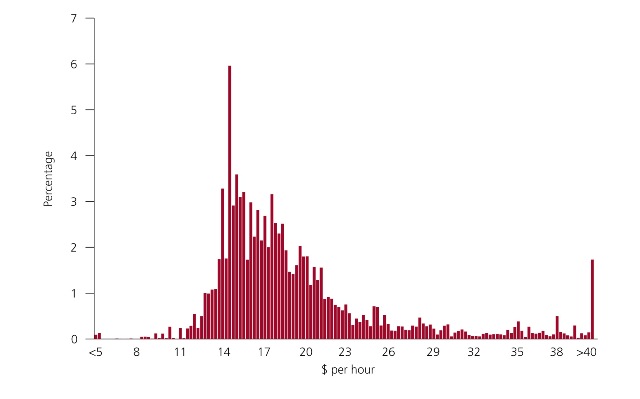
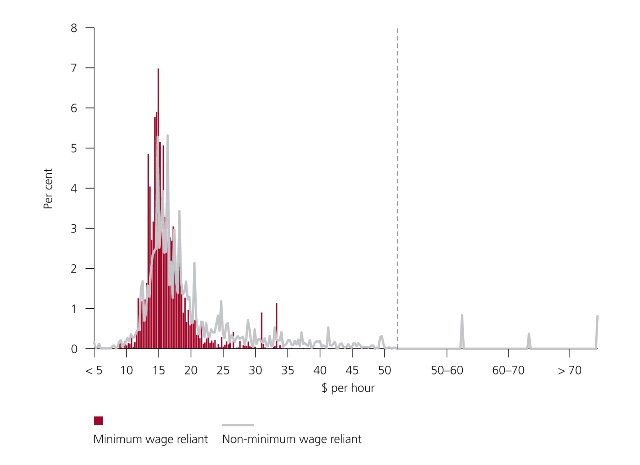
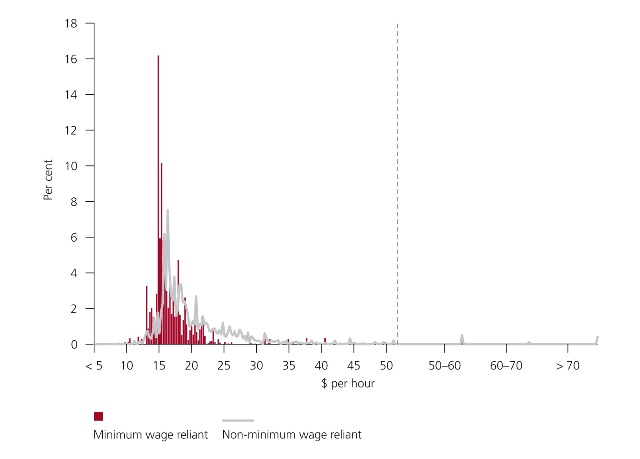
The majority of adult employees who were reliant on minimum rates of pay and who did not receive a casual loading received between $13.50 and $21.00 per hour in hourly ordinary-time earnings in May 2006 (Figure 1). Around 55 per cent earned between $13.50 and $18.50 per hour – including 6 per cent that earned between $14.50 and $14.75 per hour. A further 16 per cent earned between $18.50 and $21.00 per hour.
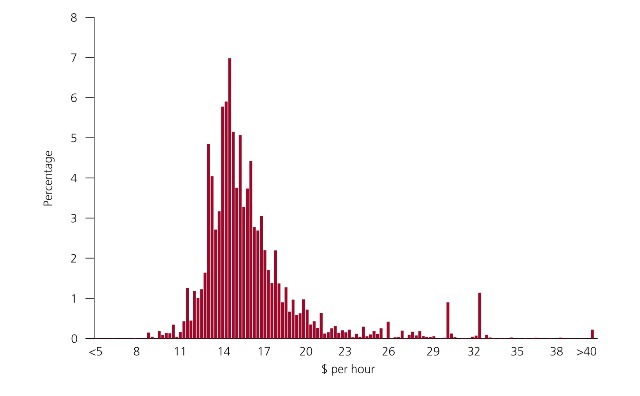
Put in terms of the commonly used classification rates contained in the Metal, Engineering and Associated Industries Award 1998, over half of adult employees who were reliant on minimum rates of pay and who did not receive a casual loading earned between the C12 and C5 rates in May 2006 (Table 2). Approximately 70 per cent earned above the C10 (basic tradesperson’s) rate, and only 4 per cent earned less than the C14 rate (equivalent to the then FMW).
In comparison, the earnings distribution for adult employees who were not reliant on minimum rates of pay and who did not receive a casual loading was considerably more dispersed, and as expected, more concentrated towards the higher end (Figure 2). The peak of the distribution was between $15.75 and $21.00 per hour, with around 30 per cent earning in this range. Following the peak, the downward trend was gradual, with around half of the distribution spread out between $21.00 and $40.00 per hour.
Part of these differences in earnings between those employees who were reliant on minimum rates of pay and those who were not is due to differences in the composition of the two groups, for example differences in the occupations in which they tend to be employed. For the three major occupational groups (identified in Section 3) which most typically used minimum rates of pay, the differences in earnings between the two groups are somewhat smaller (see Appendix 1).
Figure 1: Distribution of hourly ordinary-time cash earnings for adult permanent employees
receiving minimum rates of pay
Source: ABS, Microdata: Employee Earnings and Hours, Expanded CURF, Australia, Catalogue No. 6306.0.55.001, May 2006.
Table 2: Distribution of hourly ordinary-time cash earnings for adult permanent employees receiving minimum rates of pay by ‘Metals Award’ classification
|
|
Hourly rate of pay |
|
| |
|
|
Minimum |
Maximum |
Percentage in range |
Cumulative percentage |
≤C14 |
Production employee |
0.00 |
12.75 |
4.0 |
4.0 |
Between C14 and C13 |
12.75 |
13.19 |
1.9 |
5.9 | |
Between C13 and C12 |
13.19 |
13.78 |
3.6 |
9.5 | |
Between C12 and C11 |
13.78 |
14.33 |
7.9 |
17.4 | |
Between C11 and C10 |
Tradesperson |
14.33 |
15.22 |
11.7 |
29.2 |
Between C10 and C9 |
15.22 |
15.77 |
5.4 |
34.6 | |
Between C9 and C8 |
15.77 |
16.31 |
5.3 |
39.9 | |
Between C8 and C7 |
16.31 |
16.81 |
5.2 |
45.1 | |
Between C7 and C6 |
16.81 |
17.91 |
11.1 |
56.2 | |
Between C6 and C5 |
17.91 |
18.46 |
4.9 |
61.2 | |
Between C5 and C4 |
18.46 |
19.01 |
3.4 |
64.6 | |
Between C4 and C3 |
19.01 |
20.10 |
7.5 |
72.1 | |
Between C3 and C2(a) |
20.10 |
20.65 |
3.1 |
75.2 | |
Between C2(a) and C2(b) |
20.65 |
21.64 |
4.6 |
79.8 | |
Between C2(b) and C1(a) |
21.64 |
23.84 |
4.9 |
84.7 | |
Between C1(a) and C1(b) |
Professional |
23.84 |
27.13 |
4.9 |
89.5 |
Above C1(b) |
|
27.13 |
|
10.5 |
100.0 |
Source: ABC, Microdata: Employee Earnings and Hours, Expanded CURF, Australia, Catalogue No. 6306.0.55.001, may 2006; Metal, Engineering and Associated Industries Award 1988.
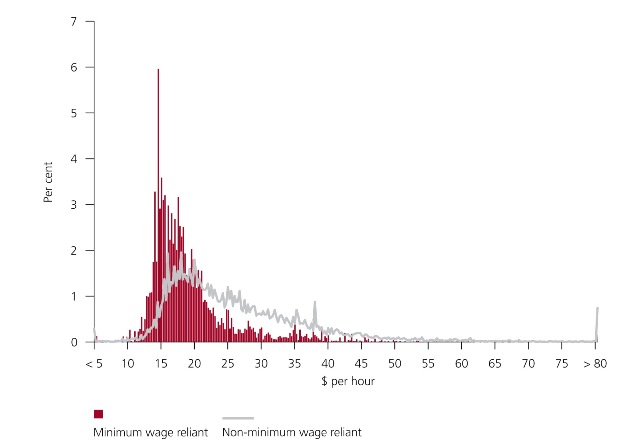
Figure 2: Distribution of hourly ordinary-time cash earnings for adult permanent employeesSource: ABS, Microdata: Employee Earnings and Hours, Expanded CURF, Australia, Catalogue No. 6306.0.55.001, May 2006.
1.2.1.2 Casual employees
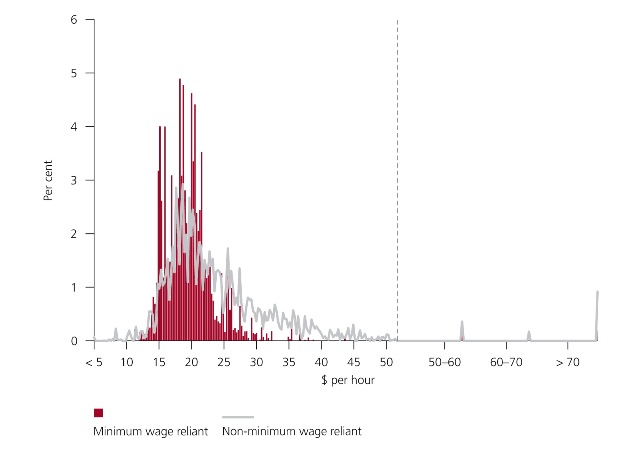
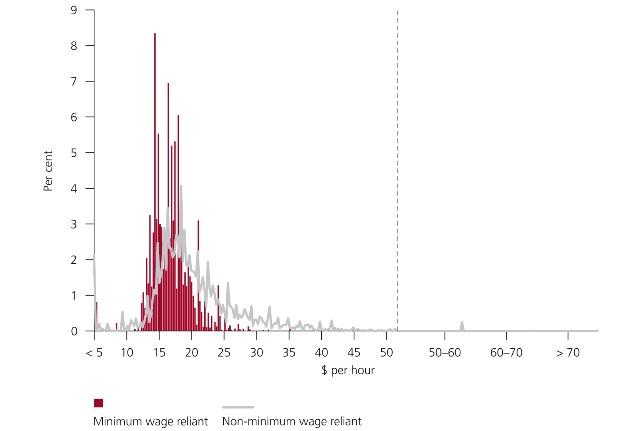
As of May 2006, the distribution of hourly ordinary-time earnings for adult employees who were reliant on minimum rates of pay and who did receive a casual loading was less dispersed than for adult permanent employees. Around 70 per cent received between $15.75 and $21.00 per hour in hourly ordinary-time earnings (Figure 3) – including 7 per cent who earned between $17.75 and $18.00 per hour.
However, these results include earnings received as a result of casual loading. If it is assumed that all casual employees received a casual loading of 25 per cent, and the earnings of casual employees are discounted for this 25 per cent loading, then the ‘peak’ of the distribution moves to between $12.75 and $17.00 per hour, with around 70 per cent of employees earning between these rates (Figure 4). In this case, the earnings of adult employees who were reliant on minimum rates of pay and who did receive a casual loading are distributed more towards the lower end of the earnings distribution than for permanent employees. In terms of the classification rates in the ‘Metals Award’, around 30 per cent would be found to have earned between the C10 and C6 rates (Table 3), around another 30 per cent would have earned between the C12 and C10 rates, and around one-quarter would have earned less than the C12 rate, including over 8 per cent who earned less than the C14 rate.
Again, the comparable earnings distribution for adult employees who were not reliant on minimum rates of pay was more dispersed and concentrated towards the higher end (Figure 5), but the differences were not as great as they were for employees who did not receive a casual loading. Around 55 per cent of employees not receiving minimum rates of pay who received a casual loading earned between $13.25 and $18.75 per hour.
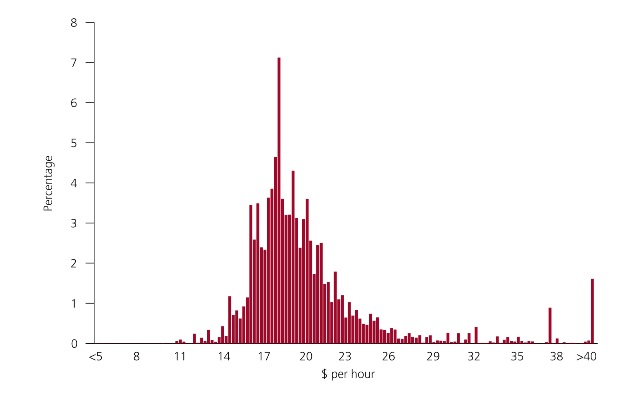
Figure 3: Distribution of hourly ordinary-time cash earnings for adult casual employees receiving minimum rates of pay
Source: ABS, Microdata: Employee Earnings and Hours, Expanded CURF, Australia, Catalogue No. 6306.0.55.001, May 2006.
Figure 4: Distribution of hourly ordinary-time cash earnings for adult casual employees receiving minimum rates of pay discounted for a 25 per cent casual loading
Source: ABS, Microdata: Employee Earnings and Hours, Expanded CURF, Australia, Catalogue No. 6306.0.55.001, May 2006.
Table 3: Distribution of hourly ordinary-time cash earnings for adult casual employees receiving minimum rates of pay discounted for a 25 per cent casual loading by ‘Metals Award’ classification rates
Hourly rate of pay |
|||||
Minimum |
Maximum |
Percentage in range |
Cumulative percentage | ||
≤C14 |
Production employee |
0.00 |
12.75 |
8.5 |
8.5 |
Between C14 and C13 |
12.75 |
13.19 |
7.8 |
16.2 | |
Between C13 and C12 |
13.19 |
13.78 |
7.5 |
23.8 | |
Between C12 and C11 |
13.78 |
14.33 |
13.7 |
37.5 | |
Between C11 and C10 |
Tradesperson |
14.33 |
15.22 |
17.9 |
55.4 |
Between C10 and C9 |
15.22 |
15.77 |
7.7 |
63.0 | |
Between C9 and C8 |
15.77 |
16.31 |
7.5 |
70.5 | |
Between C8 and C7 |
16.31 |
16.81 |
6.0 |
76.6 | |
Between C7 and C6 |
16.81 |
17.91 |
7.9 |
84.5 | |
Between C6 and C5 |
17.91 |
18.46 |
2.1 |
86.6 | |
Between C5 and C4 |
18.46 |
19.01 |
1.9 |
88.5 | |
Between C4 and C3 |
19.01 |
20.10 |
3.1 |
91.6 | |
Between C3 and C2(a) |
20.10 |
20.65 |
0.7 |
92.3 | |
Between C2(a) and C2(b) |
20.65 |
21.64 |
1.2 |
93.5 | |
Between C2(b) and C1(a) |
21.64 |
23.84 |
1.3 |
94.8 | |
Between C1(a) and C1(b) |
Professional |
23.84 |
27.13 |
1.7 |
96.5 |
Above C1(b) |
27.13 |
3.5 |
100.0 | ||
Source: ABS, Microdata: Employee Earnings and Hours, Expanded CURF, Australia, Catalogue No. 6306.0.55.001, May 2006; Metal, Engineering and Associated Industries Award 1998.
Figure 5: Distribution of hourly ordinary-time cash earnings for adult casual employees discounted for a 25 per cent casual loading
Note: Employees earning above $50.00 per hour have been grouped due to confidentiality reasons.
1.2.2 Junior employees who are reliant on minimum rates of pay
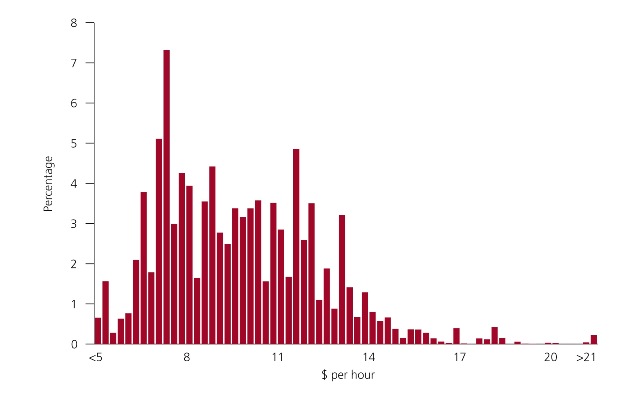
After discounting the earnings of casual employees for a 25 per cent casual loading, around 90 per cent of junior employees who were reliant on a minimum rate of pay received hourly ordinary-time earnings of less than $12.75 per hour (the then FMW) in May 2006 (Figure 6). The ‘peak’ of the distribution is between $6.25 and $8.00 per hour, which contains around 30 per cent of the employees – including 7 per cent who earned between $7.00 and $7.25 per hour.
For junior employees, the earnings distributions for those employees receiving minimum rates of pay and those employees not receiving minimum rates of pay are similar (Figure 7). One notable difference is that around 20 per cent of junior employees who were not reliant on minimum rates of pay earned more than $12.75 per hour.
Figure 6: Distribution of hourly ordinary-time cash earnings for junior employees receiving minimum rates of pay, with earnings of casual employees discounted for a 25 per cent casual loading
Source: ABS, Microdata: Employee Earnings and Hours, Expanded CURF, Australia, Catalogue No. 6306.0.55.001, May 2006.
Figure 7: Distribution of hourly ordinary-time cash earnings for junior employees, with earnings of casual employees discounted for a 25 per cent casual loading
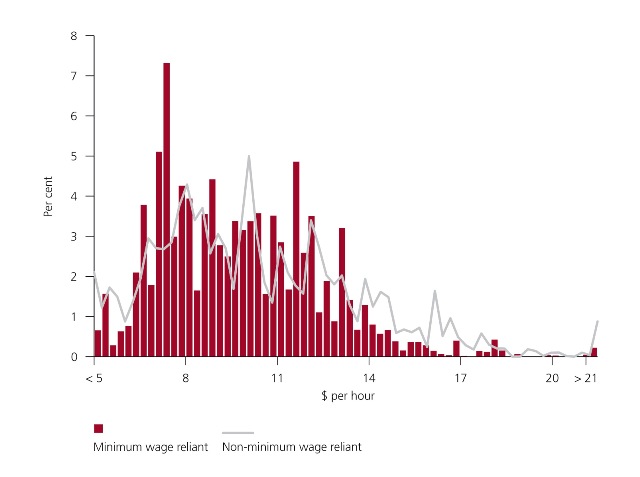
Source: ABS, Microdata: Employee Earnings and Hours, Expnaded CURF, Australia, Catalogue No. 63060.0.55.001, May 2006.
2 Occupational status of employees reliant on minimum rates of pay
This section describes the occupational status of employees who are reliant on minimum rates of pay, using the detailed occupational data from the 2006 EEH CURF. In relation to occupational status, the following questions were considered:
These questions may yield different results. An occupation with many employees may have a relatively large number of employees who receive minimum rates of pay but a relatively small proportion of employees in that occupation who receive minimum rates of pay (and vice versa).
Some caution should be taken with regard to aspects of this analysis due to the small sample sizes, particularly at the detailed occupational level. (Table 4 shows the number of observations in the CURF for each occupational group.)
2.1 Major occupational group (ANZSCO 1-digit level)
Under the ANZSCO classification, the major occupational groups with the highest percentages of minimum wage reliant employees as of May 2006 were (Table 4):
These were also the major occupational groups with the highest degree of minimum wage reliance. Of the people classified as Community and personal service workers 39.2 per cent were reliant on minimum wages, while the percentages for Sales workers and Labourers were 32.4 per cent and 29.7 per cent respectively.
2.2 Sub-major and minor occupational groups (ANZSCO 2-digit and 3-digit levels)
Each of the major occupational groups includes a range of occupations that may vary considerably in their size and degree of minimum wage reliance. Examining the more detailed occupational data gives a better idea of the types of jobs in which minimum wage workers are predominantly located and/or which are most reliant on minimum wages.
2.2.1 Community and personal service workers
At the sub-major occupation group level, of the 23.0 per cent of minimum wage reliant employees classified as Community and personal service workers the majority were classified as either Carers and aides (9.9 per cent) or Hospitality workers (8.2 per cent). Carers and aides is further divided into three minor groups, with Personal carers and assistants8 (5.8 per cent) and Child carers (3.5 per cent) accounting for most of the minimum wage reliant employees.
The proportion of employees classified as Community and personal service workers in May 2006 who were reliant on minimum wages was 39.2 per cent. Hospitality workers had the highest degree of minimum wage reliance of any sub-major occupational group (60.7 per cent). The degree of minimum wage reliance was lower for the sub-major group Carers and aides (44.2 per cent), but within this group it was very high for Child carers (69.4 per cent) and high for Personal carers and assistants (44.9 per cent). The minor occupational group Prison and security officers also had a high degree of minimum wage reliance (48.6 per cent).
Of the 20.1 per cent of minimum wage reliant employees classified as Sales workers, Sales assistants and salespersons (15.1 per cent) made up the majority of these employees at both the sub-major and minor occupation group levels. In part due to its relatively large size, Sales assistants and salespersons accounted for the largest share of minimum wage reliant employees of both all sub-major occupational groups and all minor occupational groups. However, its degree of minimum wage reliance, while high (34.5 per cent), was not as high as several other sub-major and minor occupational groupings. Within Sales workers, the sub-major occupational group Sales support workers had a slightly higher degree of minimum wage reliance (37.9 per cent), which is in large part due to the high degree of minimum wage reliance among the minor occupational group Checkout operators and office cashiers (44.2 per cent).
Of the 18.2 per cent of minimum wage reliant employees classified as Labourers, Cleaners and laundry workers (7.7 per cent) and Food preparation assistants9 (4.5 per cent) made up the majority of these employees at both the sub-major and minor occupation group levels. Both of these groups also had high degrees of minimum wage reliance (55.9 per cent and 46.2 per cent respectively), as did Miscellaneous labourers10 (27.6 per cent).
2.2.4 Other occupational groups
No other sub-major or minor occupation group accounted for a substantial share of minimum wage reliant employees, but several had relatively high proportions of employees who were reliant on minimum wage rates. Notable points include:
This report provided detailed information on the earnings and occupational status of employees who are receiving minimum rates of pay, using data from the May 2006 EEH survey. After deriving a measure of hourly ordinary-time earnings, it was found that:
Relatively few adult employees were found to have earned below the then FMW, although in the past other survey data has shown the coverage of the FMW (based purely on the amounts that employees earn) to be considerably higher. Also, the figures contained in this report will have changed since May 2006, due to increases in minimum rates of pay and other factors.
In terms of occupational status, the major occupational groups in which employees receiving minimum rates of pay are predominantly located include Community and personal service workers, Sales workers, and Labourers. Looking at the sub-major occupation group level, Carers and aides and Hospitality workers made up the majority of minimum wage workers within the first of these major occupational groups, Sales assistants and salespersons made up the majority of the second, and Cleaners and laundry workers and Food preparation assistants made up the majority of the third.
The same major occupational groups also had the largest percentage of employees within that occupational group who were minimum wage reliant. Looking at the sub-major and minor occupation group levels, we find that:
Other variables within the EEH CURF, when cross-classified with the earnings and occupational data, may be useful for future research topics, such as gender and full-time/part-time status.
Table 4: Minimum wage reliance by occupation group (ANZSCO 1-digit, 2-digit, and 3-digit levels)
|
Total number of observations for occupation in CURF |
Percentage of minimum wage reliant employees in occupation |
Percentage of employees in occupation who are minimum wage reliant |
1. Managers |
5242 |
1.2 |
2.6 |
11. Chief Executives, General Managers and Legislators |
610 |
0.0 |
0.0 |
111. Chief Executives, General Managers and Legislators |
610 |
0.0 |
0.0 |
12. Farmers and Farm Managers |
14 |
0.0 |
0.0 |
121. Farmers and Farm Managers |
14 |
0.0 |
0.0 |
13. Specialist Managers |
3372 |
0.6 |
2.3 |
131. Advertising and Sales Managers |
614 |
0.0 |
0.9 |
132. Business Administration Managers |
1401 |
0.1 |
0.6 |
133. Construction, Distribution and Production Managers |
570 |
0.0 |
0.6 |
134. Education, Health and Welfare Services Managers |
287 |
0.5 |
13.5 |
135. ICT Managers |
227 |
0.0 |
1.3 |
139. Miscellaneous Specialist Managers |
273 |
0.0 |
0.0 |
14. Hospitality, Retail and Service Managers |
1246 |
0.6 |
4.7 |
141. Accommodation and Hospitality Managers |
203 |
0.3 |
12.7 |
142. Retail Managers |
368 |
0.2 |
3.9 |
149. Miscellaneous Hospitality, Retail and Service Managers |
675 |
0.1 |
1.8 |
2. Professionals |
11 837 |
6.6 |
6.6 |
21. Arts and Media Professionals |
397 |
0.1 |
4.1 |
211. Arts Professionals |
88 |
0.0 |
5.6 |
212. Media Professionals |
309 |
0.1 |
3.7 |
22. Business, Human Resource and Marketing Professionals |
3400 |
0.6 |
2.5 |
221. Accountants, Auditors and Company Secretaries |
836 |
0.0 |
0.5 |
222. Financial Brokers and Dealers, and Investment Advisers |
468 |
0.0 |
1.6 |
223. Human Resource and Training Professionals |
627 |
0.3 |
6.6 |
224. Information and Organisation Professionals |
768 |
0.1 |
2.1 |
225. Sales, Marketing and Public Relations Professionals |
701 |
0.1 |
2.3 |
23. Design, Engineering, Science and Transport Professionals |
1702 |
0.4 |
3.2 |
231. Air and Marine Transport Professionals |
153 |
0.1 |
11.0 |
232. Architects, Designers, Planners and Surveyors |
375 |
0.1 |
2.6 |
233. Engineering Professionals |
573 |
0.1 |
1.3 |
234. Natural and Physical Science Professionals |
601 |
0.2 |
4.3 |
24. Education Professionals |
2599 |
3.0 |
11.1 |
241. School Teachers |
1597 |
2.3 |
12.1 |
242. Tertiary Education Teachers |
722 |
0.1 |
0.9 |
249. Miscellaneous Education Professionals |
280 |
0.7 |
24.3 |
25. Health Professionals |
1958 |
1.9 |
9.4 |
251. Health Diagnostic and Promotion Professionals |
290 |
0.3 |
10.0 |
252. Health Therapy Professionals |
178 |
0.1 |
3.2 |
253. Medical Practitioners |
252 |
0.1 |
3.3 |
254. Midwifery and Nursing Professionals |
1238 |
1.4 |
11.8 |
26. ICT Professionals |
919 |
0.2 |
2.5 |
261. Business and Systems Analysts, and Programmers |
488 |
0.1 |
2.5 |
262. Database and Systems Administrators, and ICT Security Specialists |
199 |
0.1 |
4.3 |
263. ICT Network and Support Professionals |
232 |
0.0 |
1.5 |
27. Legal, Social and Welfare Professionals |
862 |
0.5 |
6.0 |
271. Legal Professionals |
353 |
0.1 |
2.7 |
272. Social and Welfare Professionals |
509 |
0.4 |
7.3 |
3. Technicians and Trades Workers |
6421 |
12.0 |
18.7 |
31. Engineering, ICT and Science Technicians |
1600 |
0.5 |
4.3 |
311. Agricultural, Medical and Science Technicians |
373 |
0.2 |
7.4 |
312. Building and Engineering Technicians |
745 |
0.2 |
3.3 |
313. ICT and Telecommunications Technicians |
482 |
0.1 |
3.5 |
32. Automotive and Engineering Trades Workers |
1793 |
2.5 |
13.3 |
321. Automotive Electricians and Mechanics |
452 |
1.2 |
18.0 |
322. Fabrication Engineering Trades Workers |
363 |
0.4 |
10.0 |
323. Mechanical Engineering Trades Workers |
872 |
0.4 |
6.1 |
324. Panelbeaters, and Vehicle Body Builders, Trimmers and Painters |
106 |
0.5 |
32.3 |
33. Construction Trades Workers |
620 |
2.7 |
30.2 |
331. Bricklayers, and Carpenters and Joiners |
303 |
1.5 |
33.0 |
332. Floor Finishers and Painting Trades Workers |
55 |
0.2 |
21.0 |
333. Glaziers, Plasterers and Tilers |
68 |
0.3 |
26.8 |
334. Plumbers |
194 |
0.8 |
29.7 |
34. Electrotechnology and Telecommunications Trades Workers |
882 |
1.4 |
16.4 |
341. Electricians |
493 |
0.8 |
19.2 |
342. Electronics and Telecommunications Trades Workers |
389 |
0.5 |
13.5 |
35. Food Trades Workers |
492 |
2.1 |
32.9 |
351. Food Trades Workers |
492 |
2.1 |
32.9 |
36. Skilled Animal and Horticultural Workers |
284 |
1.0 |
36.2 |
361. Animal Attendants and Trainers, and Shearers |
69 |
0.3 |
36.2 |
362. Horticultural Trades Workers |
215 |
0.7 |
36.2 |
39. Other Technicians and Trades Workers |
750 |
1.8 |
27.5 |
391. Hairdressers |
93 |
1.1 |
63.3 |
392. Printing Trades Workers |
164 |
0.1 |
12.7 |
393. Textile, Clothing and Footwear Trades Workers |
45 |
0.1 |
18.9 |
394. Wood Trades Workers |
93 |
0.4 |
36.0 |
399. Miscellaneous Technicians and Trades Workers |
355 |
0.1 |
4.7 |
4. Community and Personal Services Workers |
5778 |
23.0 |
39.2 |
41. Health and Welfare Support Workers |
845 |
1.4 |
19.2 |
411. Health and Welfare Support Workers |
845 |
1.4 |
19.2 |
42. Carers and Aides |
1985 |
9.9 |
44.2 |
421. Child Carers |
478 |
3.5 |
69.4 |
422. Education Aides |
336 |
0.5 |
12.7 |
423. Personal Carers and Assistants |
1171 |
5.8 |
44.9 |
43. Hospitality Workers |
1201 |
8.2 |
60.7 |
431. Hospitality Workers |
1201 |
8.2 |
60.7 |
44. Protective Service Workers |
1034 |
2.3 |
26.1 |
441. Defence Force Members, Fire Fighters and Police |
406 |
0.0 |
0.1 |
442. Prison and Security Officers |
628 |
2.3 |
48.6 |
45. Sports and Personal Service Workers |
713 |
1.2 |
17.7 |
451. Personal Service and Travel Workers |
355 |
0.8 |
24.2 |
452. Sports and Fitness Workers |
358 |
0.3 |
10.5 |
5. Clerical and Administrative Workers |
12 004 |
13.2 |
13.3 |
51. Office Managers and Program Administrators |
1715 |
1.1 |
8.3 |
511. Contract, Program and Project Administrators |
1086 |
0.2 |
3.3 |
512. Office and Practice Managers |
629 |
0.9 |
12.8 |
52. Personal Assistants and Secretaries |
869 |
0.7 |
8.6 |
521. Personal Assistants and Secretaries |
869 |
0.7 |
8.6 |
53. General Clerical Workers |
2454 |
3.7 |
17.9 |
531. General Clerks |
2155 |
3.2 |
17.4 |
532. Keyboard Operators |
299 |
0.5 |
22.3 |
54. Inquiry Clerks and Receptionists |
2080 |
3.8 |
20.9 |
541. Call or Contact Centre Information Clerks |
1100 |
0.6 |
7.8 |
542. Receptionists |
980 |
3.2 |
29.8 |
55. Numerical Clerks |
2241 |
2.0 |
11.6 |
551. Accounting Clerks and Bookkeepers |
1312 |
1.5 |
12.8 |
552. Financial and Insurance Clerks |
929 |
0.5 |
8.9 |
56. Clerical and Office Support Workers |
723 |
0.6 |
10.6 |
561. Clerical and Office Support Workers |
723 |
0.6 |
10.6 |
59. Other Clerical and Administrative Workers |
1922 |
1.2 |
8.1 |
591. Logistics Clerks |
836 |
0.8 |
11.0 |
599. Miscellaneous Clerical and Administrative Workers |
1086 |
0.4 |
5.5 |
6. Sales Workers |
5687 |
20.1 |
32.4 |
61. Sales Representatives and Agents |
782 |
0.5 |
8.2 |
611. Insurance Agents and Sales Representatives |
557 |
0.1 |
2.4 |
612. Real Estate Sales Agents |
225 |
0.4 |
21.4 |
62. Sales Assistants and Salespersons |
3774 |
15.1 |
34.5 |
621. Sales Assistants and Salespersons |
3774 |
15.1 |
34.5 |
63. Sales Support Workers |
1131 |
4.4 |
37.9 |
631. Checkout Operators and Office Cashiers |
716 |
3.9 |
44.2 |
639. Miscellaneous Sales Support Workers |
415 |
0.5 |
18.4 |
7. Machinery Operators and Drivers |
4726 |
5.7 |
16.3 |
71. Machine and Stationary Plant Operators |
1706 |
1.0 |
9.5 |
711. Machine Operators |
556 |
0.8 |
16.6 |
712. Stationary Plant Operators |
1150 |
0.2 |
3.8 |
72. Mobile Plant Operators |
765 |
0.7 |
13.7 |
721. Mobile Plant Operators |
765 |
0.7 |
13.7 |
73. Road and Rail Drivers |
1450 |
2.6 |
21.4 |
731. Automobile, Bus and Rail Drivers |
765 |
0.6 |
24.5 |
732. Delivery Drivers |
352 |
0.6 |
29.5 |
733. Truck Drivers |
234 |
1.5 |
18.7 |
74. Storepersons |
805 |
1.4 |
19.4 |
741. Storepersons |
805 |
1.4 |
19.4 |
8. Labourers |
6722 |
18.2 |
29.7 |
81. Cleaners and Laundry Workers |
1460 |
7.7 |
55.9 |
811. Cleaners and Laundry Workers |
1460 |
7.7 |
55.9 |
82. Construction and Mining Labourers |
667 |
0.4 |
5.6 |
821. Construction and Mining Labourers |
667 |
0.4 |
5.6 |
83. Factory Process Workers |
1911 |
2.7 |
17.1 |
831. Food Process Workers |
577 |
0.5 |
12.0 |
832. Packers and Product Assemblers |
872 |
1.4 |
19.2 |
839 .Miscellaneous Factory Process Workers |
462 |
0.8 |
18.6 |
84. Farm, Forestry and Garden Workers |
438 |
0.4 |
14.4 |
841. Farm, Forestry and Garden Workers |
438 |
0.4 |
14.4 |
85. Food Preparation Assistants |
899 |
4.5 |
46.2 |
851. Food Preparation Assistants |
899 |
4.5 |
46.2 |
89. Other Labourers |
1347 |
2.5 |
21.2 |
891. Freight Handlers and Shelf Fillers |
450 |
0.5 |
11.3 |
899. Miscellaneous Labourers |
897 |
2.0 |
27.6 |
All occupations |
58 417 |
100.0 |
19.0 |
Source: ABS, Microdata: Employee Earnings and Hours, Expanded CURF, Australia, Catalogue No. 6306.0.55.001, May 2006.
Note: Figures in the final two columns have been adjusted using survey weights.
Award Review Taskforce (2006), Final Report on Rationalisation of Wage and Classification Structures, Canberra.
McGuinness S, Freebairn J and Mavromaras K, (2007) Characteristics of Minimum Wage Employees, Australian Fair Pay Commission Research Report No. 2/07, Melbourne.
Appendix 1: Earnings distributions by occupation for adult employees who did not receive a casual loading
Figure 8: Distribution of hourly ordinary-time cash earnings for adult permanent employees classified as Community and personal services workers
Source: ABS, Microdata: Employee Earnings and Hours, Expanded CURF, Australia, Catalogue No. 6306.0.55.001, May 2006.
Note: Employees earning above $50.00 per hour have been grouped due to confidentiality reasons.
Figure 9: Distribution of hourly ordinary-time cash earnings for adult permanent employees classified as Sales workers
Source: ABS, Microdata: Employee Earnings and Hours, Expanded CURF, Australia, Catalogue No. 6306.0.55.001, May 2006.
Note: Employees earning above $50.00 per hour have been grouped due to confidentiality reasons.
Figure 10: Distribution of hourly ordinary-time cash earnings for adult permanent employees classified as Labourers
Source: ABS, Microdata: Employee Earnings and Hours, Expanded CURF, Australia, Catalogue No. 6306.0.55.001, May 2006.
Note: Employees earning above $50.00 per hour have been grouped due to confidentiality reasons.
1 The survey covers all employing organisations in Australia except businesses primarily engaged in Agriculture, forestry and fishing, private households employing staff, and foreign embassies, consulates, etc. Employees of employers covered in the survey are in scope if they received pay for the reference period, except members of the Australian defence forces, employees based outside Australia, and employees on workers’ compensation who are not paid through the payroll.
2 McGuinness, Freebairn and Mavromaras (2007) suggest that, in many cases, hours paid for will be less than hours actually worked. See McGuinness S, Freebairn J and Mavromaras K, (2007) Characteristics of Minimum Wage Employees, Australian Fair Pay Commission Research Report No. 2/07, Melbourne, p.8.
3 The EEH CURF also classifies employees according to whether they are employed on a permanent, fixed-term contract or casual basis. The group of employees who are classified as receiving a casual loading to compensate for their lack of leave entitlements is slightly different to the group of employees who are classified as being employed on a casual basis.
4 Award Review Taskforce (2006), Final Report on Rationalisation of Wage and Classification Structures, Canberra, p.42.
5 Based on unpublished EEH data.
6 McGuinness et al. (2007), op. cit, p.8.
7 Data in figures 1 - 7 and tables 1 - 3 have been adjusted using survey weights.
8 Personal carers and assistants include Aged and disabled carers, Dental assistants, Nursing support and personal care workers and Special care workers.
9 Food preparation assistants include Fast food cooks, Food trades assistants (e.g. Pastrycook’s assistant) and Kitchenhands.
10 Miscellaneous labourers include Caretakers, Deck and fishing hands, Handypersons, Motor vehicle parts and accessories fitters, Printing assistants and table workers, Recycling and rubbish collectors and Vending machine attendants.
11 Food trades workers include Bakers and pastrycooks, Butchers and smallgoods makers, Chefs and Cooks.
12 Construction trades workers include the minor occupation groups Bricklayers, and carpenters and joiners, Floor finishers and painting trades workers, Glaziers, plasterers and tilers, and Plumbers. For the degrees of minimum wage reliance for each of these minor occupation groups, see Table 4.
13 Wood trades workers include Cabinetmakers and Wood Machinists (e.g. Picture framers, Furniture finishers).